Visualization and monitoring solutions
/
Monitor Metrics Endpoint (Prometheus)Monitor Metrics Endpoint (Prometheus) easily with Grafana
Easily monitor any Prometheus-compatible and publicly accessible metrics URL with Grafana Cloud’s out-of-the-box monitoring solution. The Grafana Cloud forever-free tier includes 3 users and up to 10k metrics series to support your monitoring needs.
Get started with these easy steps:
- Create a free account or contact us for a Grafana Enterprise license to run it on your own infrastructure.
- Connect the data source to Metrics Endpoint (Prometheus) in Grafana.
- Explore and visualize your Metrics Endpoint (Prometheus) data in Grafana!
Need to self-manage?
Get started with these easy steps:
- Go to your Grafana Account Portal and start right now!
- Run a one-line command to install the Grafana Agent
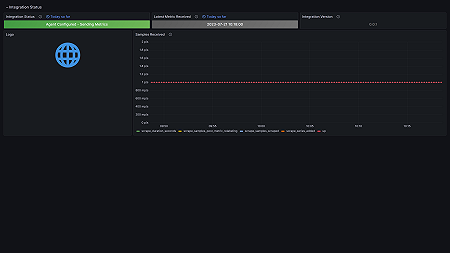
- That’s it! You’ll immediately see pre-built Grafana dashboards and alerts tailored for monitoring Metrics Endpoint (Prometheus)!
Get started with these easy steps:
- Install the Metrics Endpoint (Prometheus) plugin to get started.
- Connect the data source to Metrics Endpoint (Prometheus) in Grafana.
- Explore and visualize your Metrics Endpoint (Prometheus) data in Grafana!
Get started with these easy steps:
- Manage this plugin with your Grafana Cloud Pro account.
Get started with these easy steps:
- Install the Metrics Endpoint (Prometheus) plugin to get started.
- Connect the data source to Metrics Endpoint (Prometheus) in Grafana.
- Explore and visualize your Metrics Endpoint (Prometheus) data in Grafana!
Get started with these easy steps:
- Install the Metrics Endpoint (Prometheus) plugin to get started.
- Connect the data source to Metrics Endpoint (Prometheus) in Grafana.
- Explore and visualize your Metrics Endpoint (Prometheus) data in Grafana!
Enterprise customers have access to all Grafana Enterprise plugins.
Install the Metrics Endpoint (Prometheus) plugin to get started.
Cloud free customers have access to all Grafana Enterprise Plugins for up to 3 users.
Install the Metrics Endpoint (Prometheus) plugin to get started.
Get started with these easy steps:
- Create a free account or contact us for a Grafana Enterprise license to run it on your own infrastructure.
- Connect the data source to Metrics Endpoint (Prometheus) in Grafana.
- Explore and visualize your Metrics Endpoint (Prometheus) data in Grafana!
Need to self-manage?