
Kubernetes Monitoring
Visualize and alert on your Kubernetes cluster in minutes, not days.
Why use Kubernetes Monitoring in Grafana Cloud?
Accelerate time to value
Reduce deployment, setup, and troubleshooting time with this ready-to-use monitoring tool that only requires running a few CLI commands or adding some small changes to your Helm chart.
Identify root causes faster
Drill down through your infrastructure with the cluster navigation view to identify and resolve issues, without the hassle of switching between different windows and monitoring tools.
Reduce costs
Efficiency and cost monitoring visualizations deliver comprehensive insights into your spending, enabling data-driven decisions about resource allocation, scaling strategies, and tech investments.
Easy deployment
Deploy the Helm chart on any of the major cloud-managed Kubernetes services and Kubernetes distributions.
- Choose which features to enable
- Get Helm installation instructions tailored to your needs

Cost management
Gain better insight into your Kubernetes costs, spending trends, and potential savings with the cost monitoring feature, which is based on the open source project OpenCost.
- Usage and cost attribution on every component level
- Break down costs and resource allocation across cloud providers
- Visualize cost trends and projected savings
- Organize Kubernetes costs by resource type
- Get savings suggestions based on your resource usage

High-priority issues at a glance
Instantly identify fleet issues with an overall snapshot of all your infrastructure components that have breached preset thresholds for:
- Cluster/s CPU and memory usage
- Container image distribution
- Firing pod and container alerts

Full visibility, from Kubernetes clusters to containers
Get a full view of Kubernetes clusters, then drill down to see specific container-level information.
- Cost and resource usage attribution for every infrastructure level
- Color-coded resource usage visualizations and icons lead to faster issue identification and resolution
- Side-by-side peak vs. average resource efficiency comparisons

Optimize, analyze, and anticipate your resource usage
Instantly analyze CPU and memory usage trends. Correlate actual usage with limits and requests. Proactively identify issues to achieve optimized resource management.
- Detailed insights at every infrastructure level with historical trends
- Network, energy, logs, and events deep dive in dedicated tabs
- Resource forecasting powered by machine learning
- Automated pod CPU outlier detection


Network stability and performance insights
Identify when limits cause network saturation and dropped packets.
- Detect bandwidth limitations
- Prevent packet loss
- Optimize network performance across your fleet
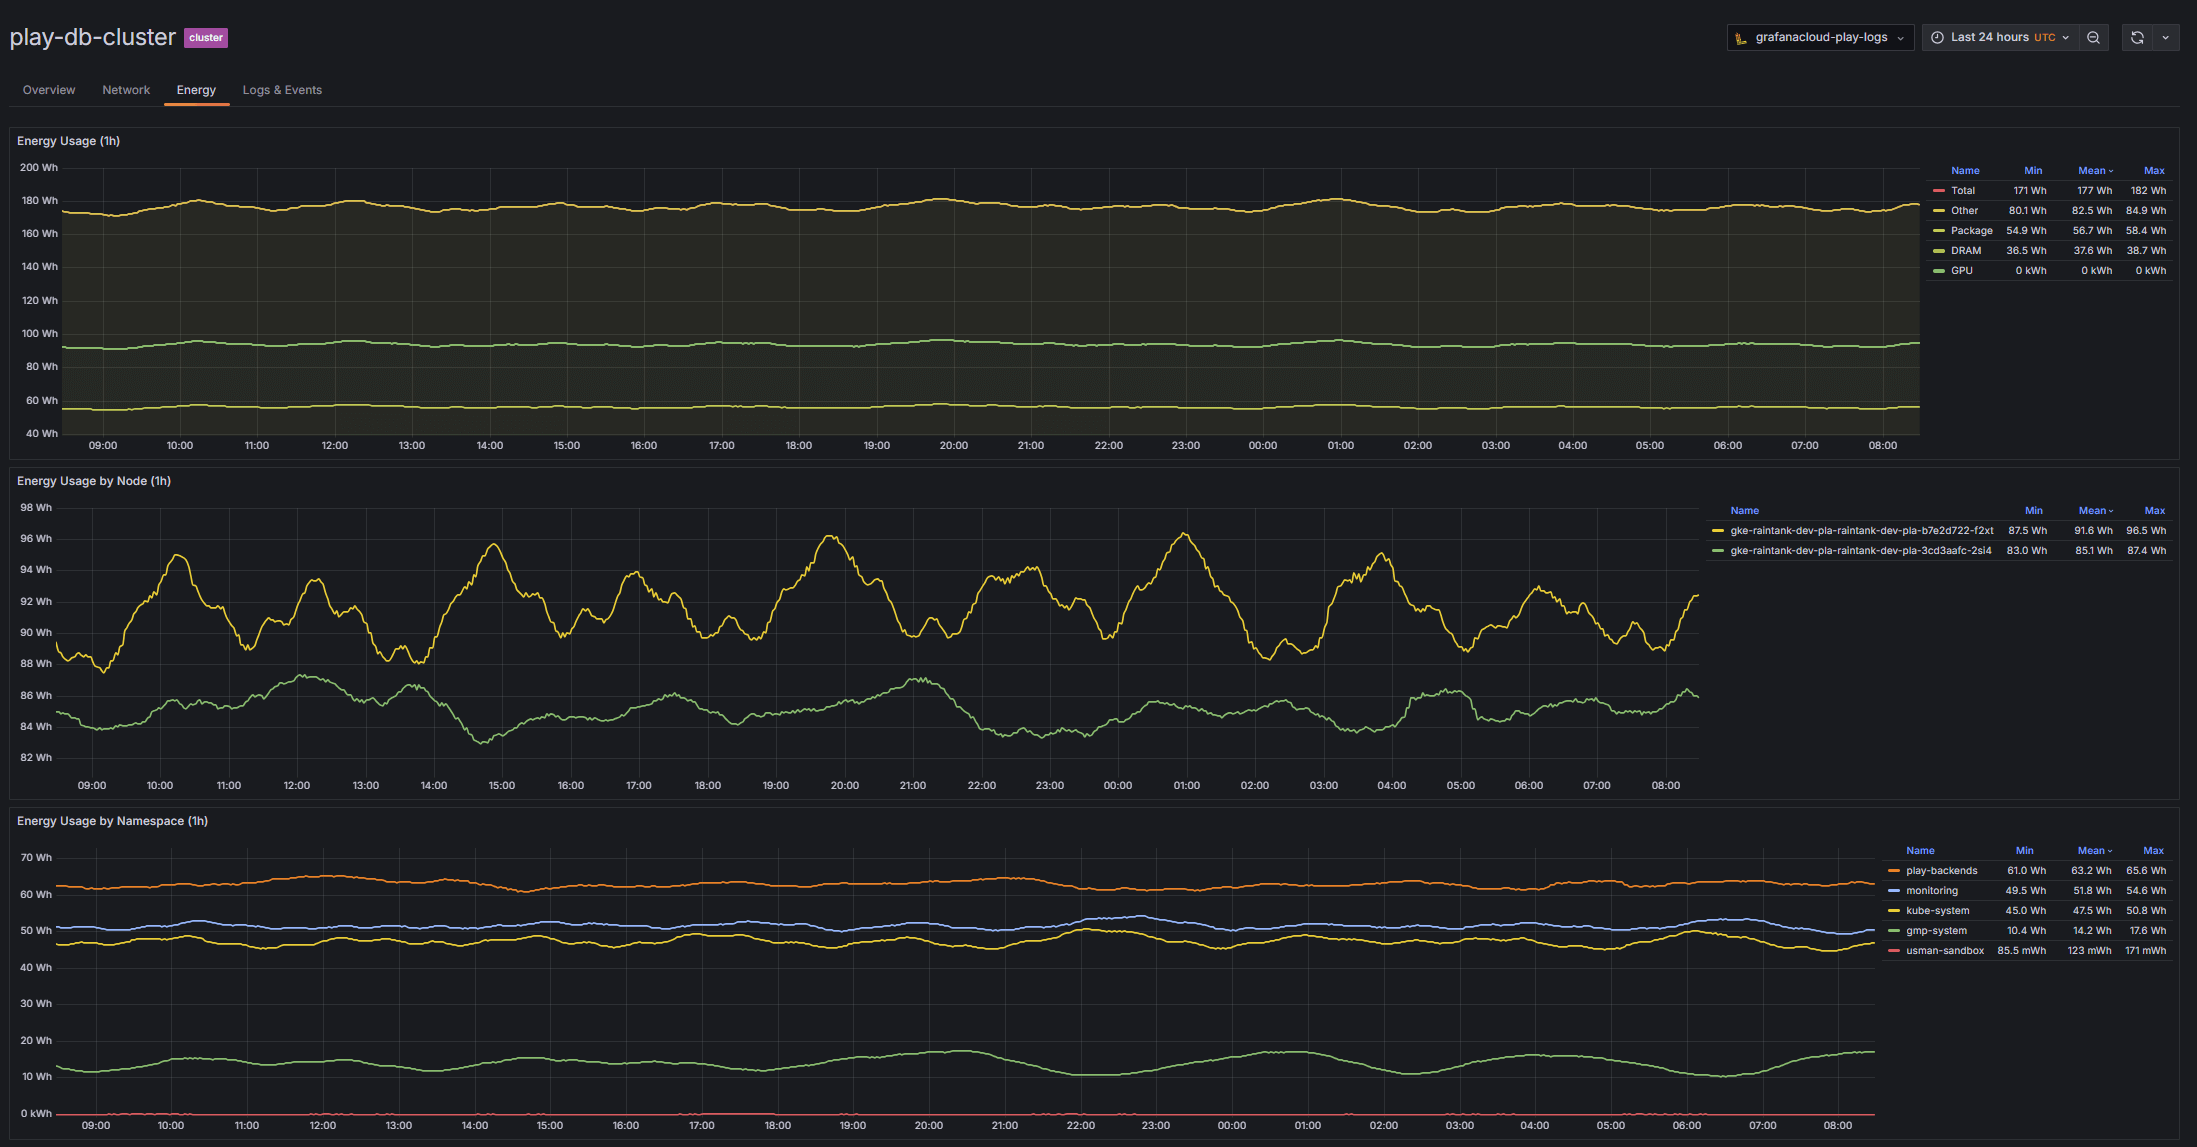
Understand your environmental footprint and energy consumption
Monitor your Kubernetes energy consumption to optimize efficiency, cut costs, and enhance sustainability.
- 24-hour GPU, DRAM, and Packages consumption trend
- Node and namespace energy consumption breakdown
Instant Prometheus-correlated logs
Prometheus’ and Grafana Loki’s metadata keep the same labels for your Kubernetes cluster, so accessing correlated Kubernetes metrics and logs couldn’t be easier.

Kubernetes container insights
Use the cluster-to-container navigation for instant container clarity.
- Sizing recommendations
- Access to historical data to pinpoint CPU throttling and restarts

Opinionated metrics and alerts
Access kube-state-metrics and alerting rules needed to effectively monitor Kubernetes clusters.
- A curated set of metrics to avoid cardinality explosion
- Community-built alerting standards

It’s easy to get started
For full implementation details and best practices
1
Sign up
Create your free Grafana Cloud account.
2
Connect your data
With a few clicks, set up default configurations for prebuilt visualizations and alerting rules.
3
Deploy
Data will stream from your cluster into Grafana Cloud.