
Adaptive Metrics
Reduce costs with Prometheus cardinality optimization
Eliminate unused metrics via custom cardinality optimizations that adapt to your cloud native environment with the Adaptive Metrics feature. Reduce metric cardinality and costs – all within the fully managed Grafana Cloud platform.
The actually useful Grafana Cloud Free plan
- 10k metrics
- 14-day metrics retention
- 3 monthly active users
- Adaptive Metrics
Reduce observability costs
Pay only for metrics that you use by eliminating time series that are never or rarely leveraged.
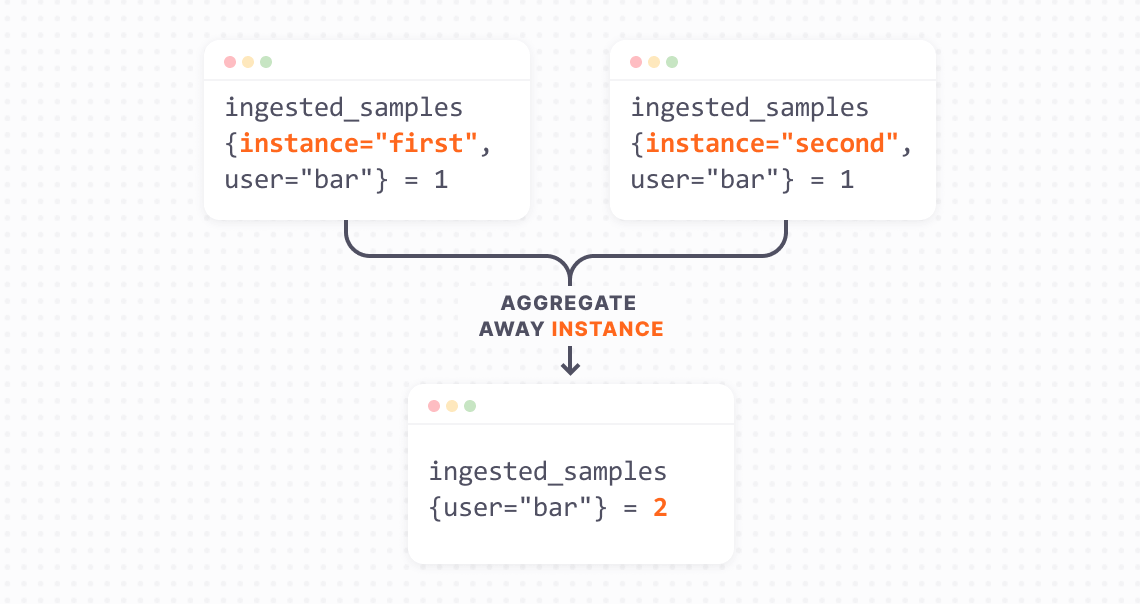
Control metrics explosion
Reduce metric time series by 20-50% with zero changes needed to your applications or remote-write setup.
Optimize without fear
Recommended aggregations respect historic usage patterns; they won’t break existing dashboards, alerts, or previously run queries.
Control your Prometheus cardinality with Grafana Cloud
Customized cardinality reduction
Adaptive Metrics continuously analyzes your incoming metrics and compares them to your dashboards, rules, and query logs. You’ll get tailored recommendations that reflect your usage patterns, allowing you to filter out unused time series.


Seamless integration into existing workflows
Choose the recommendation rules you want to apply, remove, or update with a single click through an interactive UI. Or you can use the API to view, update, change, or override rules, all managed within your CI/CD processes.
Zero disruptions to operations
Aggregated metrics keep their original name, which means you don’thave to change your queries, alerts, or dashboards after applying them.

Roll back on demand
Observability is never static: Prometheus cardinality eliminated today may be needed tomorrow. When that happens, unapply the aggregation rule with one click. Going forward, you’ll have access to the raw metric with all its labels.
How Adaptive Metrics works
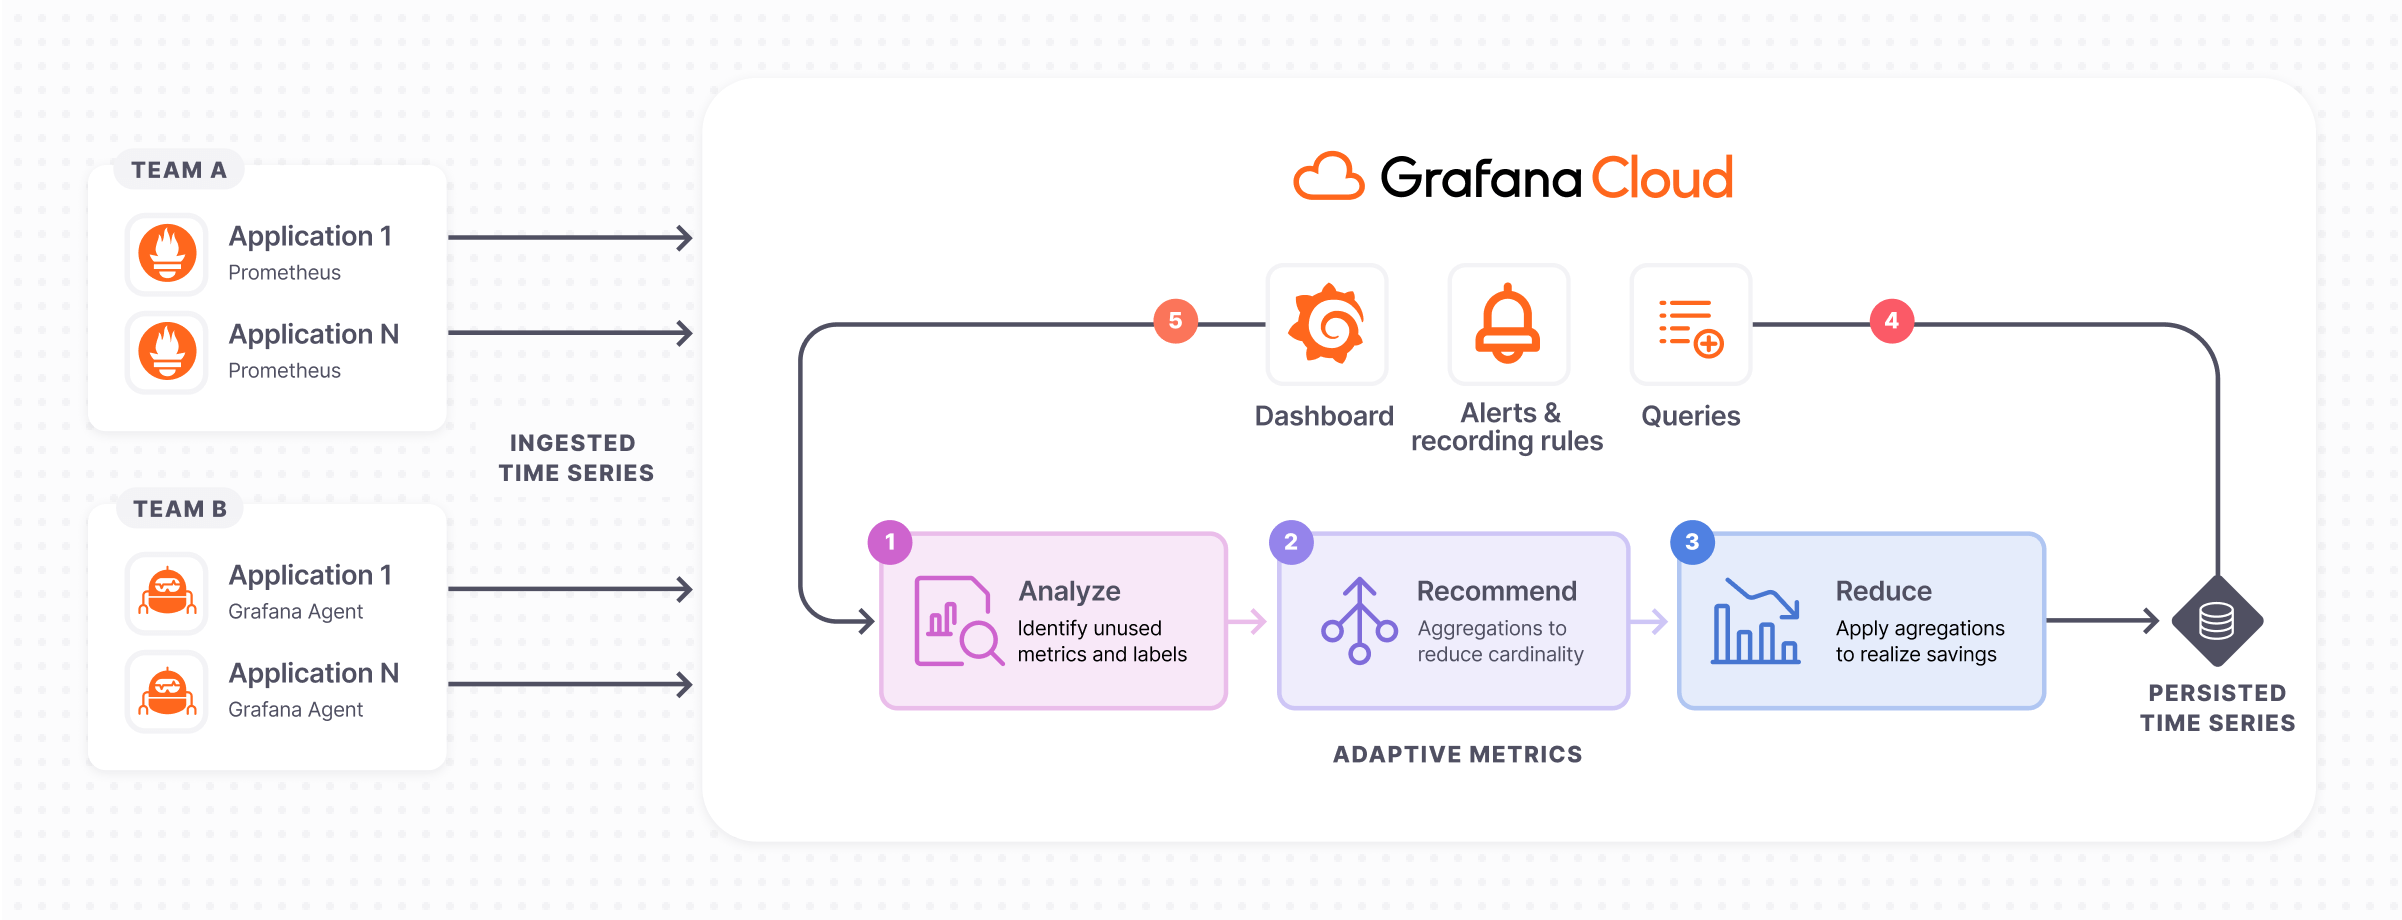
Analyze
Unused metrics and labels are identified by usage history.
Recommend
Customized aggregation rules are suggested for your environment.
Reduce
You choose which aggregation rules to apply to lower the count of persisted time series.
Integrate
Dashboards, alerts, and queries use persisted time series, ensuring seamless operation of existing observability artifacts.
Adapt
Analysis is continuous, so changes in dashboards, alerts, and query patterns prompt new aggregation suggestions.
Helpful resources
Blog
Why companies choose Adaptive Metrics and how they save time and (a lot of) money
Video
Grafana Cloud Adaptive Metrics: Reduce Prometheus high cardinality metrics
Blog
Managing Prometheus cardinality in Grafana Cloud: Adaptive Metrics FAQ
Blog
Introducing Adaptive Metrics: A new cost management feature in Grafana Cloud
Video
How to control metrics growth in Prometheus and Kubernetes with Grafana Cloud
Blog
Why companies choose Adaptive Metrics and how they save time and (a lot of) money
Blog
Manage log volumes, metrics cardinality, monthly bills: Explore Grafana Cloud cost management tools
Blog
A complete guide to metrics cost management in Grafana Cloud
Blog
How to manage high cardinality metrics in Prometheus and Kubernetes
Blog
How to manage cardinality with out-of-the-box dashboards in Grafana Cloud
Blog
What are cardinality spikes and why do they matter?