Plugins 〉kubernetes


The kubernetes plugin has been deprecated and is no longer maintained.
kubernetes


WARNING: This project is no longer maintained. Please consider using the Prometheus compatible kubernetes application: https://github.com/grafana/kubernetes-app
Grafana App for Kubernetes
Kubernetes is an open-source system for automating deployment, scaling, and management of containerized applications.
The Grafana Kubernetes App allows you to monitor your Kubernetes cluster's performance. It includes 4 dashboards, Cluster, Node, Pod/Container and Deployment. It also comes with Intel Snap collectors that are deployed to your cluster to collect health metrics. The metrics collected are high-level cluster and node stats as well as lower level pod and container stats. Use the high-level metrics to alert on and the low-level metrics to troubleshoot.
Requirements
- Currently only has support for Graphite.
- For automatic deployment of the collectors, then Kubernetes 1.4 or higher is required.
- Grafana 4 is required if using TLS Client Auth (rather than Basic Auth).
Features
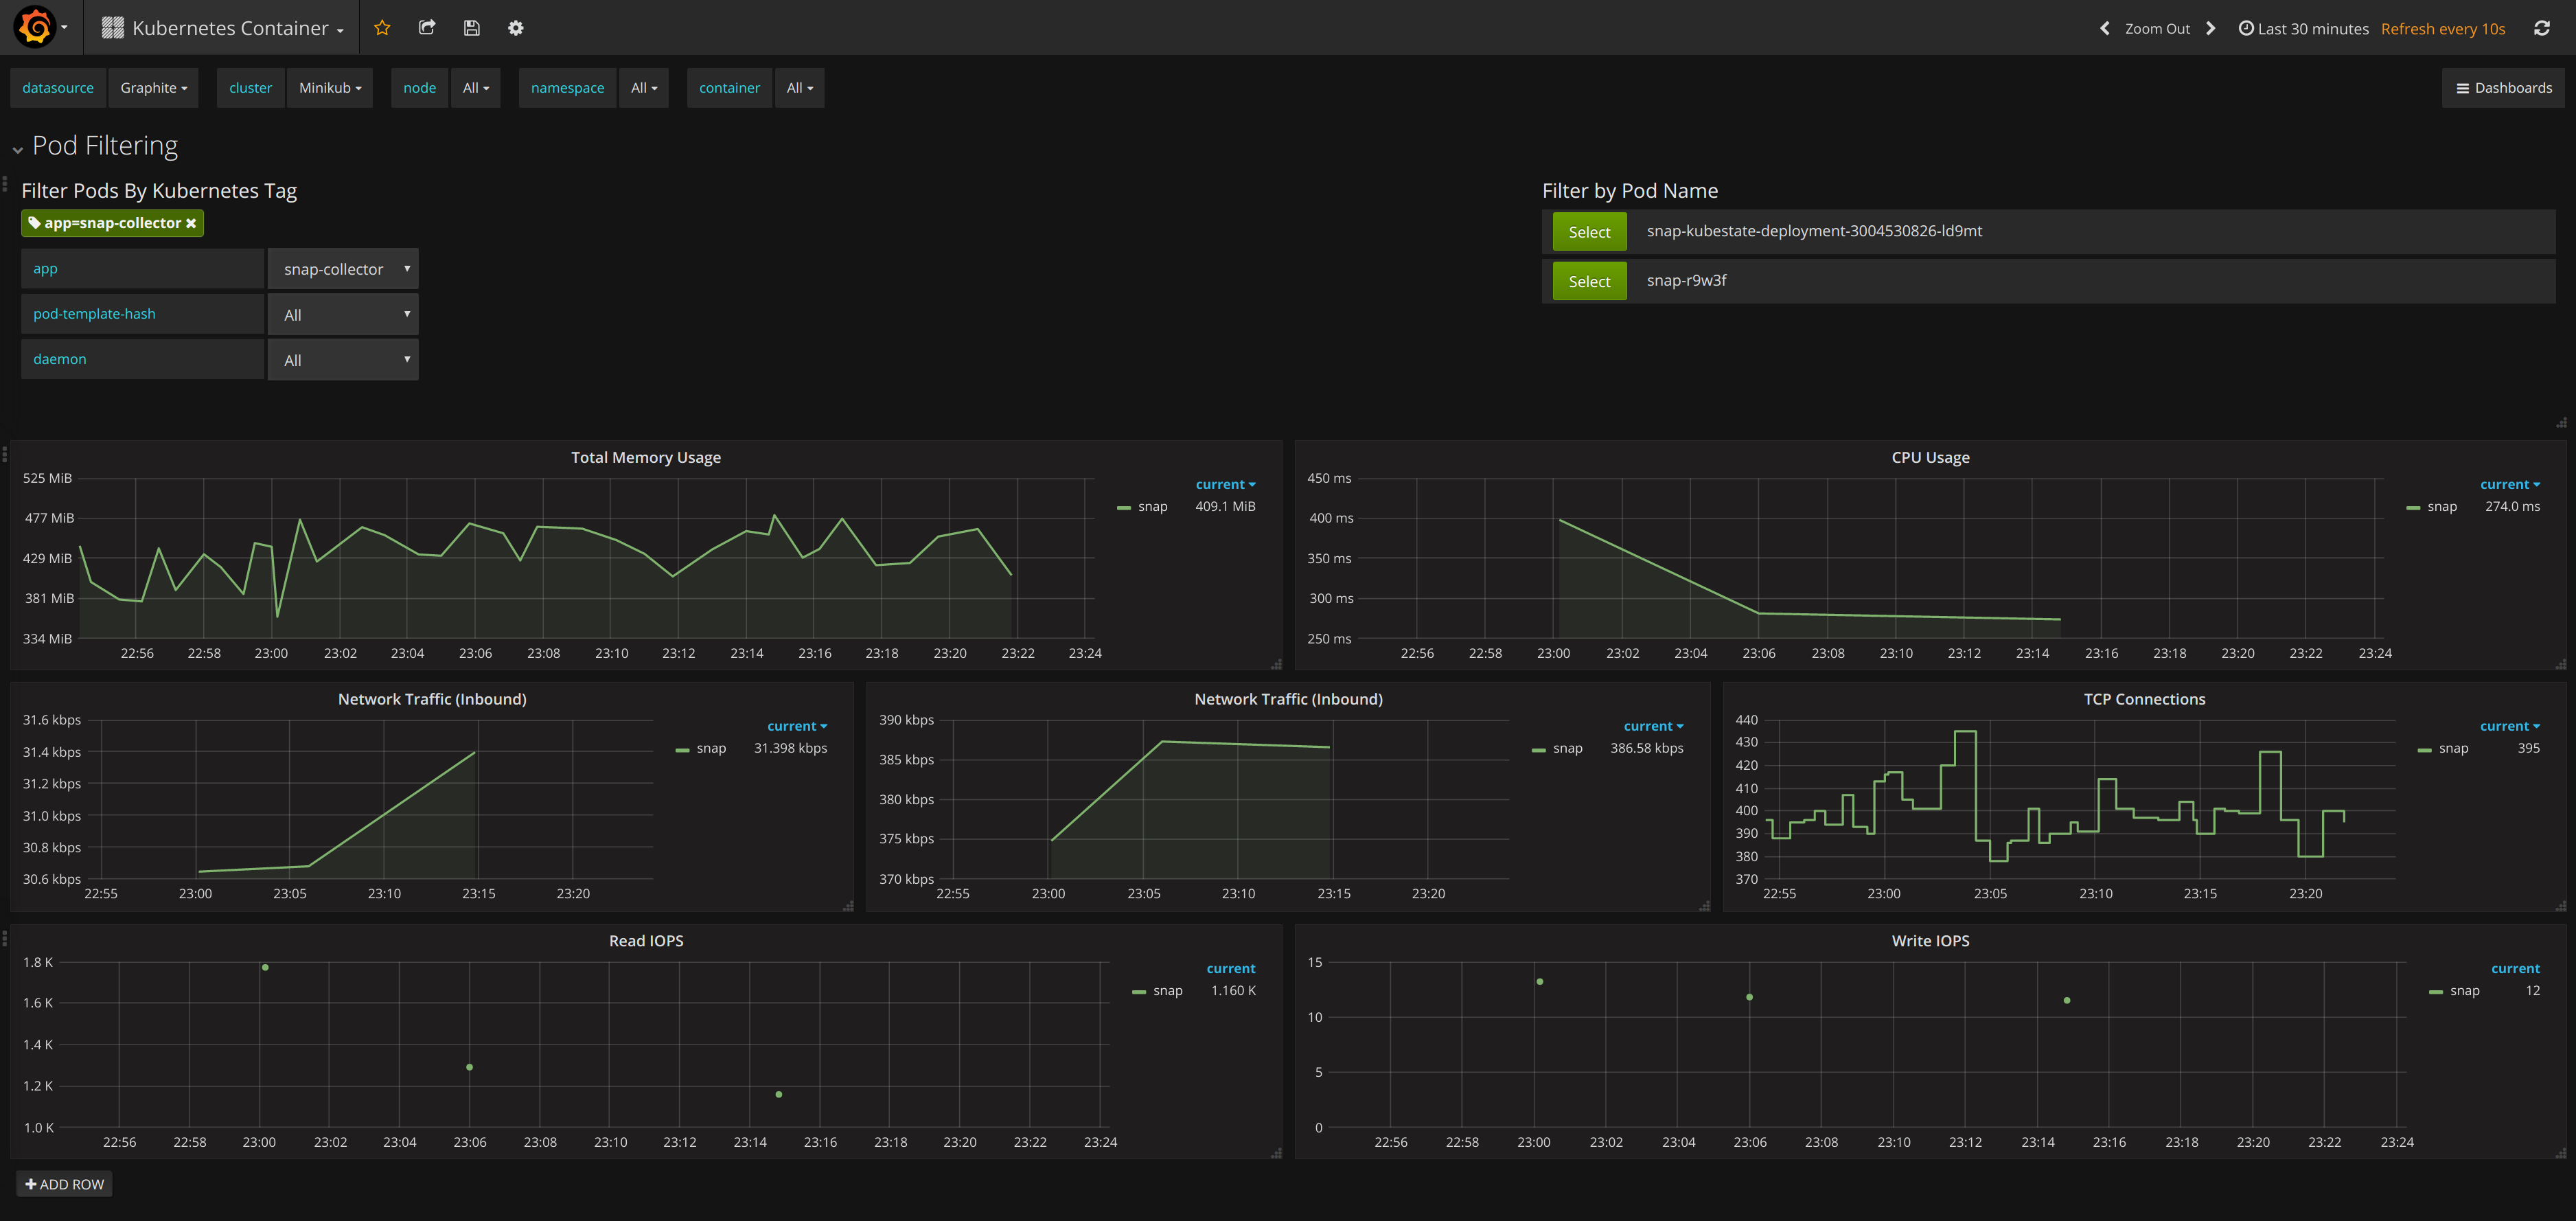
The app uses Kubernetes tags to allow you to filter pod metrics. Kubernetes clusters tend to have a lot of pods and a lot of pod metrics. The Pod/Container dashboard leverages the pod tags so you can easily find the relevant pod or pods.
Easy installation of collectors, either a one click deploy from Grafana or detailed instructions to deploy them manually them with kubectl (also quite easy!)
Cluster level metrics that are not available in Heapster, like CPU Capacity vs CPU Usage.
Pod and Container status metrics. See the Snap Kubestate Collector for more details.
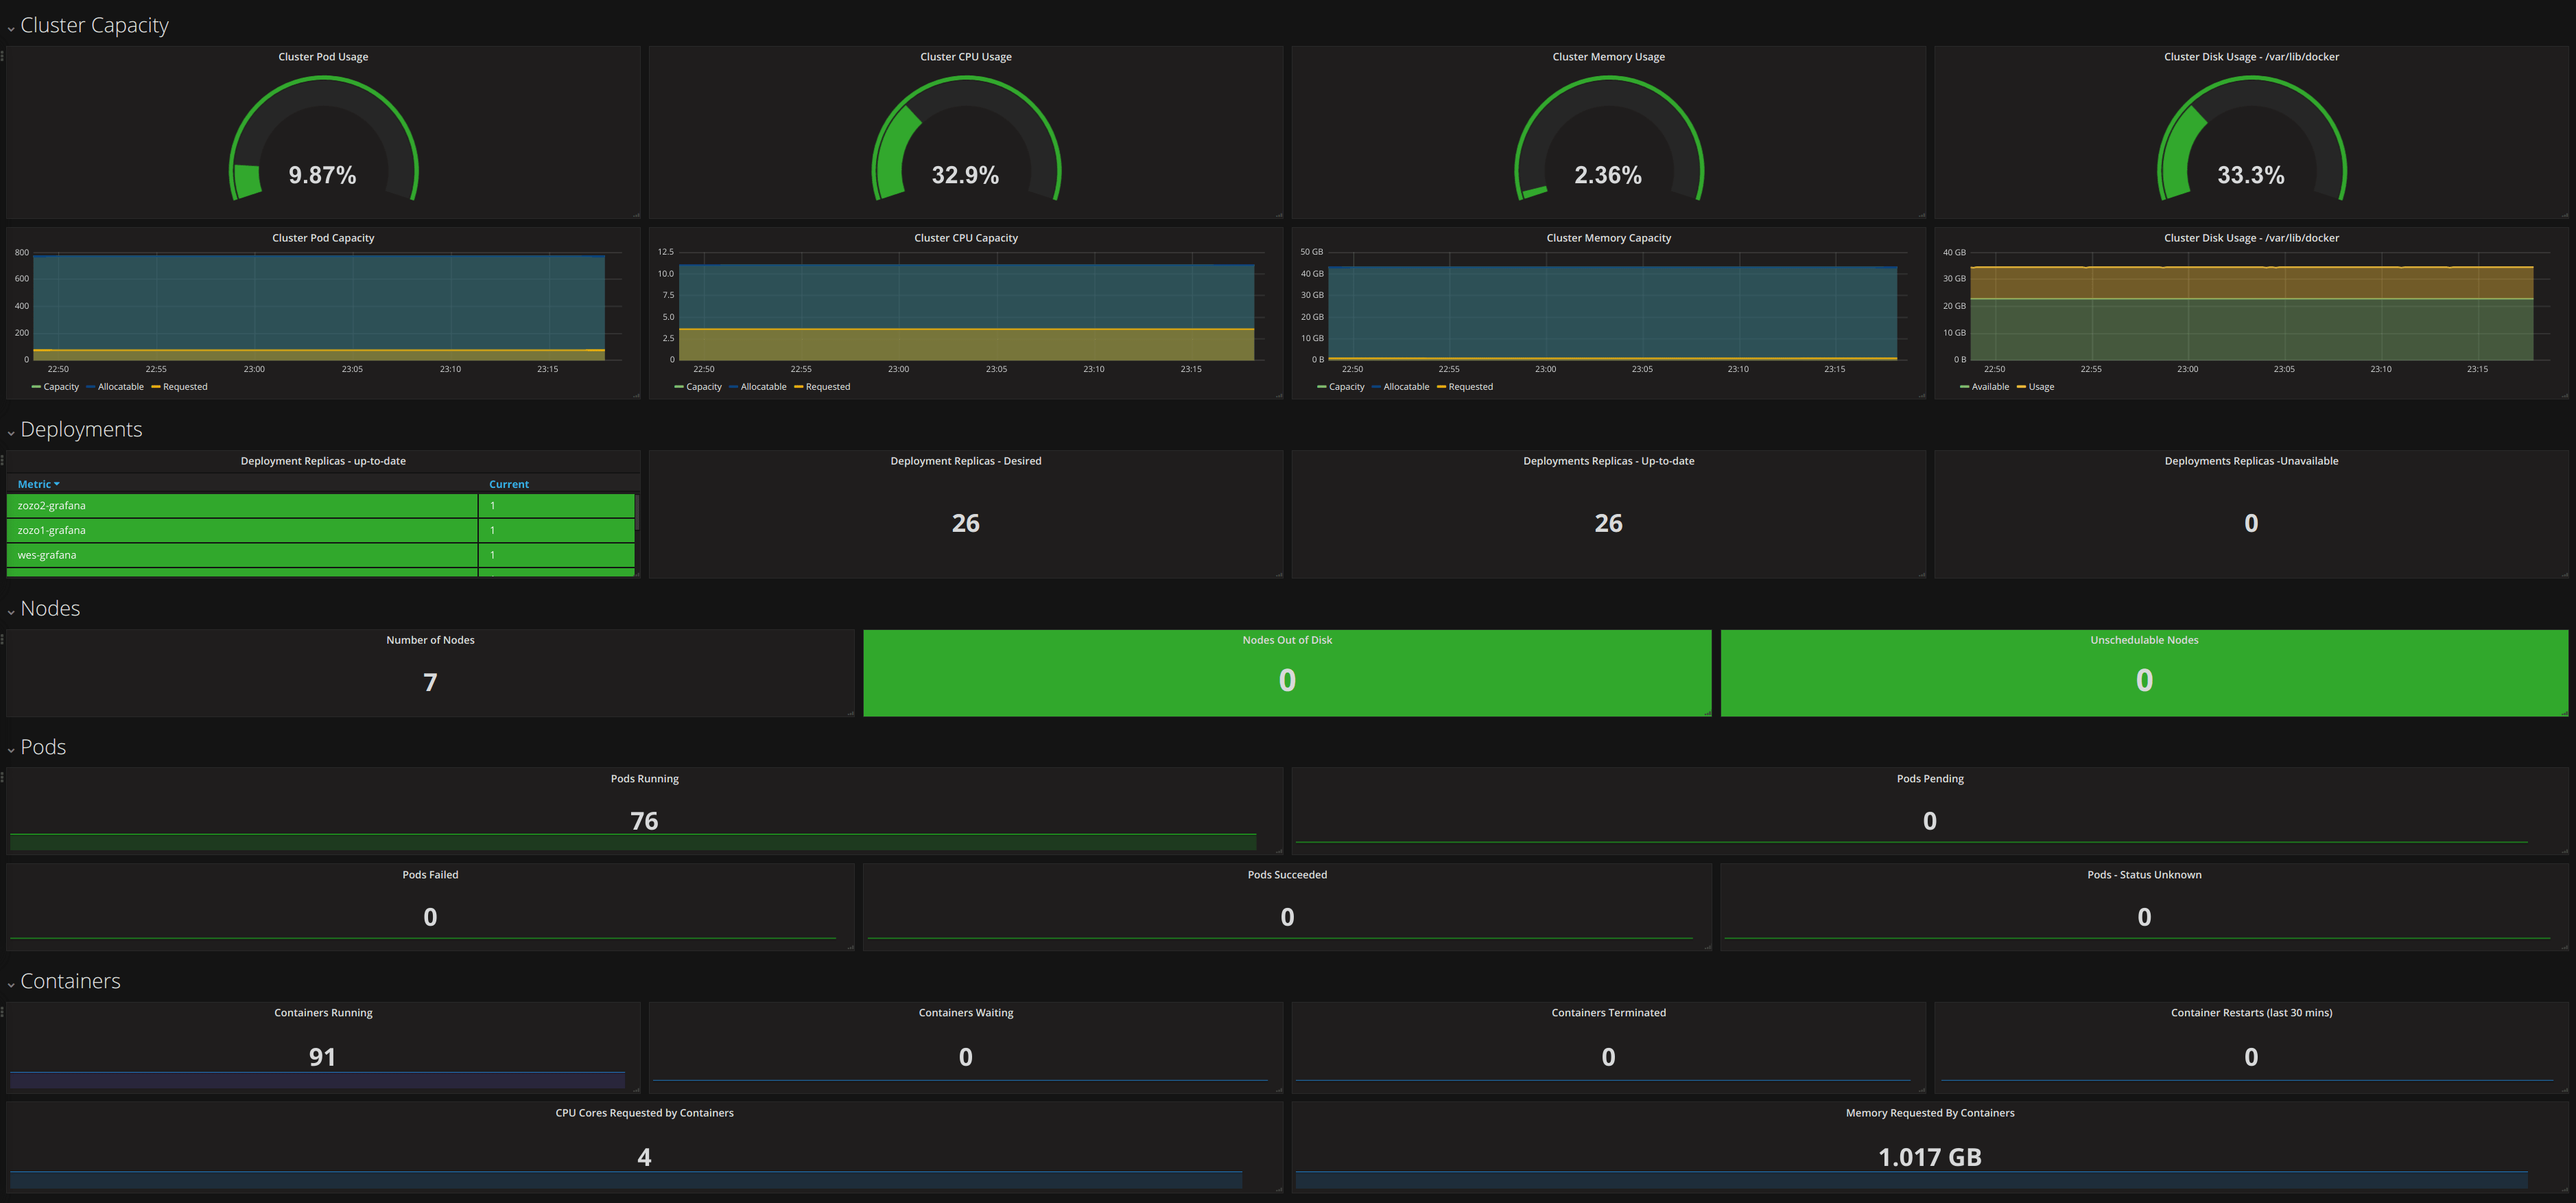
Cluster Metrics
- Pod Capacity/Usage
- Memory Capacity/Usage
- CPU Capacity/Usage
- Disk Capacity/Usage (measurements from each container's /var/lib/docker)
- Overview of Nodes, Pods and Containers
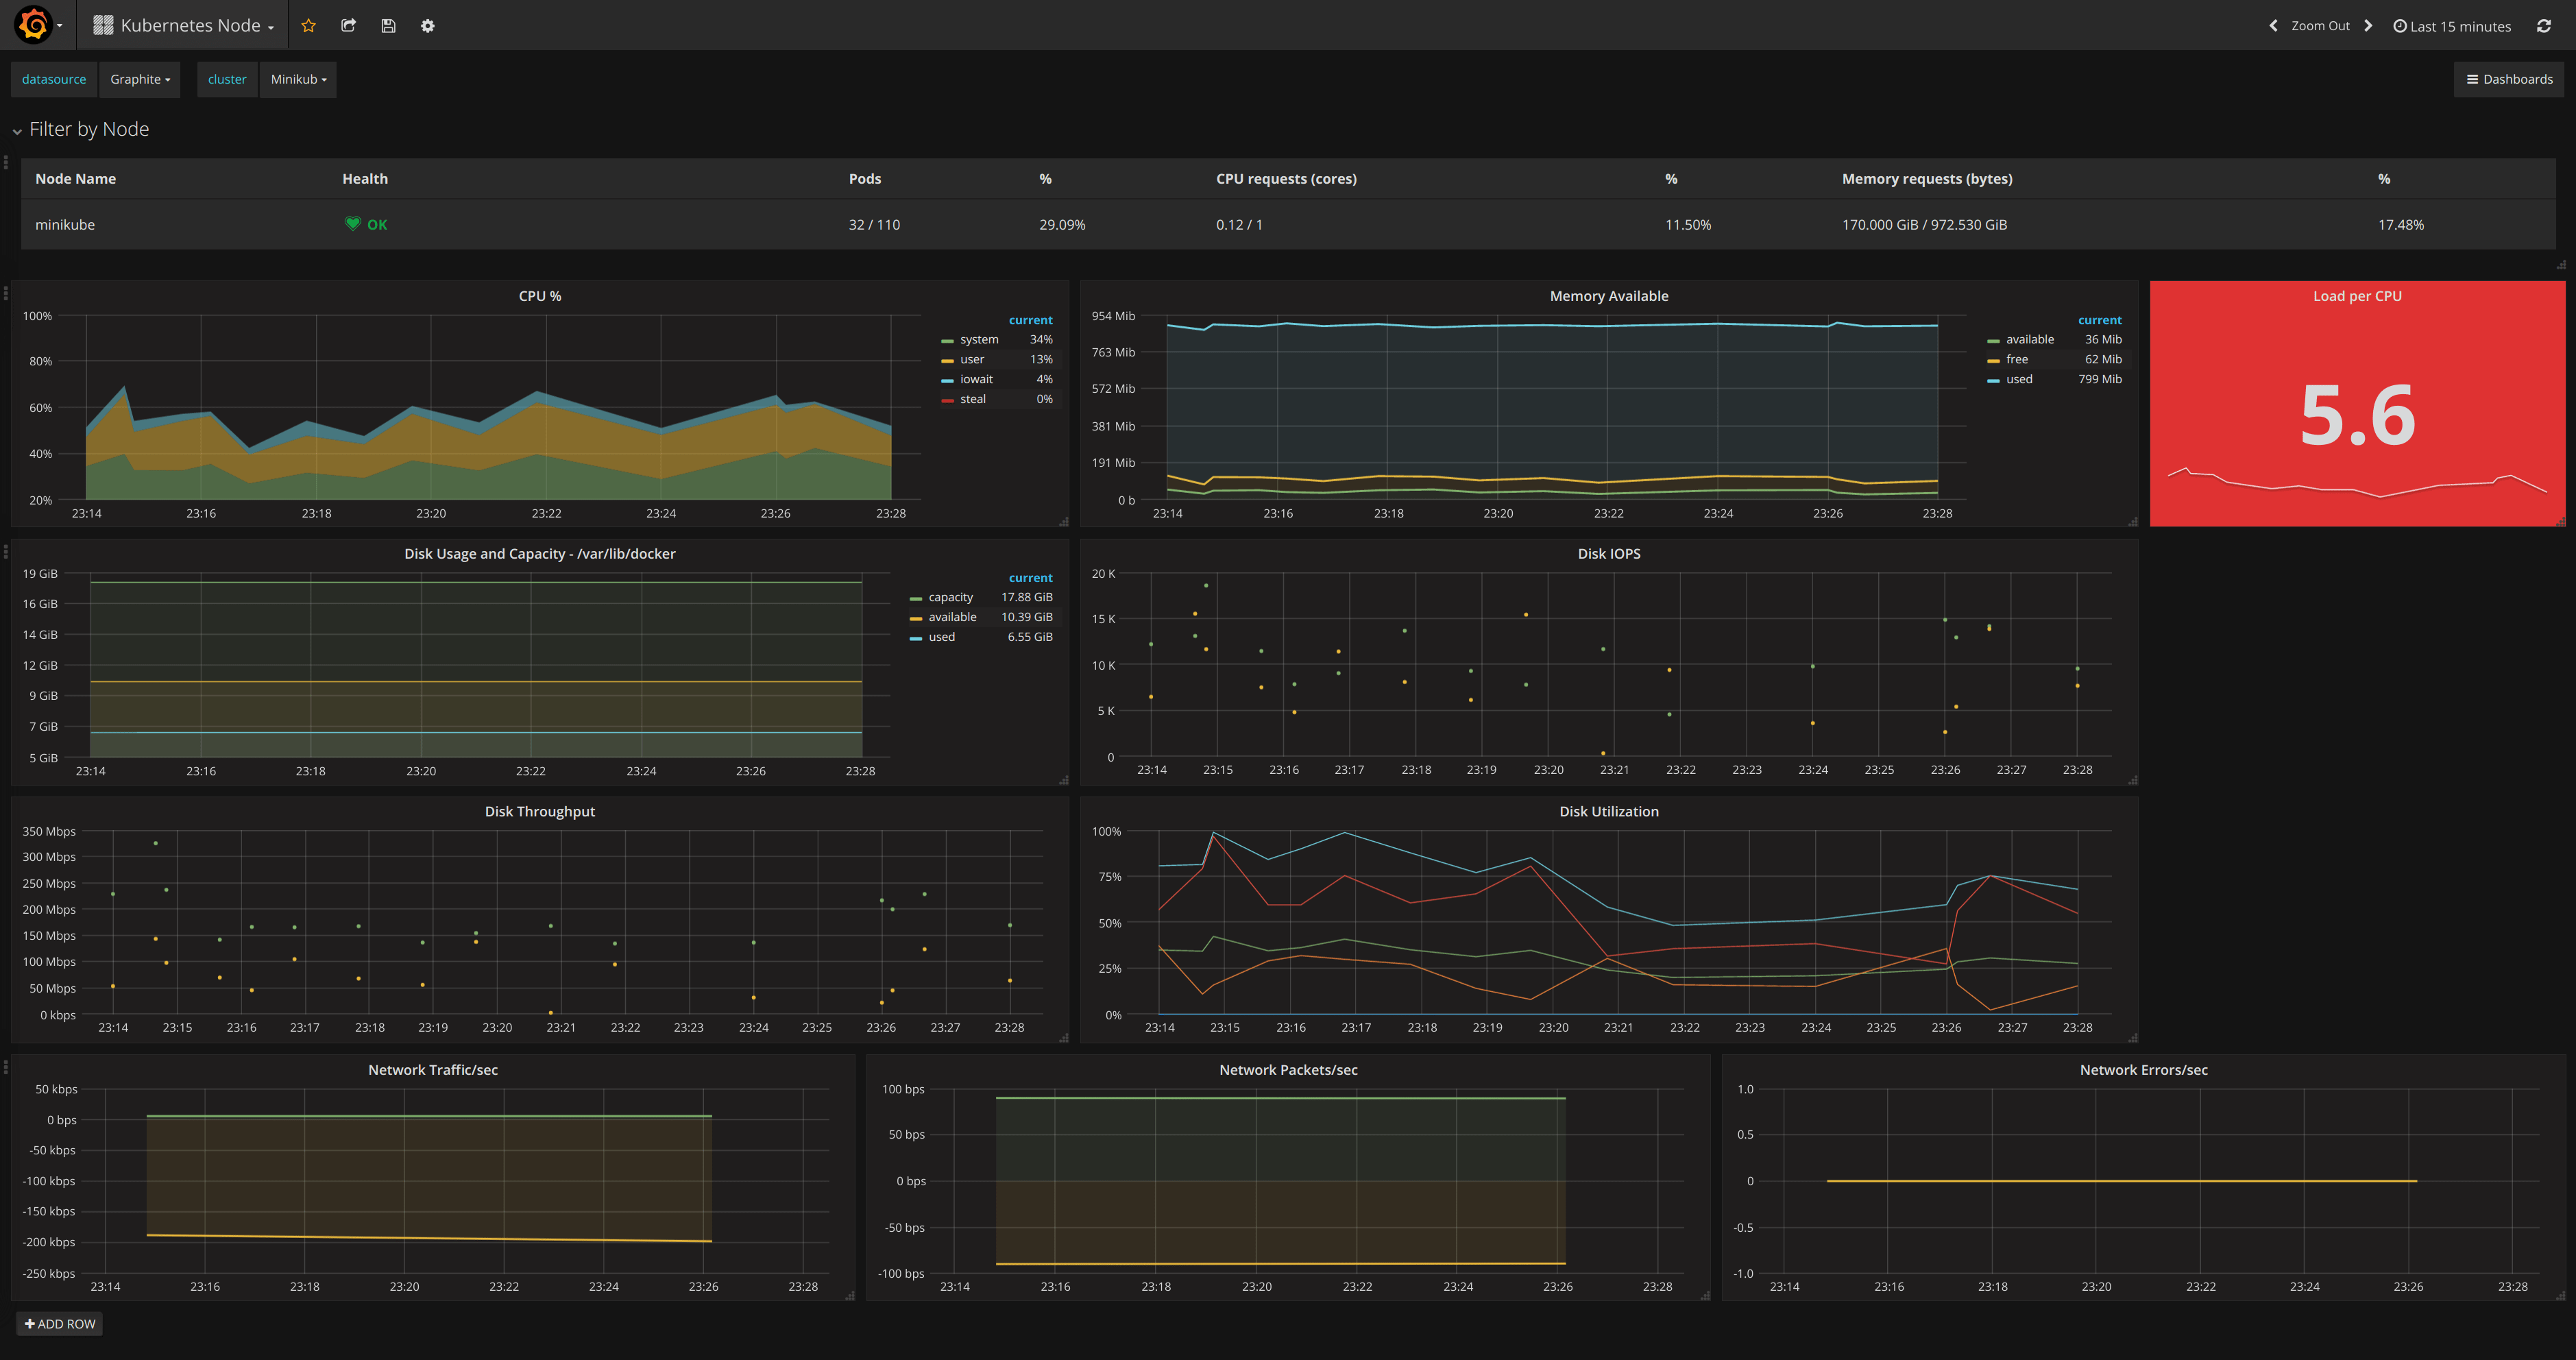
Node Metrics
- CPU
- Memory Available
- Load per CPU
- Read IOPS
- Write IOPS
- %Util
- Network Traffic/second
- Network Packets/second
- Network Errors/second
Pod/Container Metrics
- Memory Usage
- Network Traffic
- TCP Connections
- CPU Usage
- Read IOPS
- Write IOPS
- All Established TCP Conn
Documentation
Installation
- Use the grafana-cli tool to install kubernetes from the commandline:
grafana-cli plugins install raintank-kubernetes-app
Restart your Grafana server.
Log into your Grafana instance. Navigate to the Plugins section, found in the Grafana main menu. Click the Apps tabs in the Plugins section and select the newly installed Kubernetes app. To enable the app, click the Config tab and click on the Enable button.
Connecting to your Cluster
Go to the Cluster List page via the Kubernetes app menu.
Click the
New Clusterbutton.Fill in the Auth details for your cluster.
Choose the Graphite datasource that will be used for reading data in the dashboards.
Fill in the details for the Carbon host that is used to write to Graphite. This url has to be available from inside the cluster.
Click
Deploy. This will deploy a DaemonSet, to collect health metrics for every node, and a pod that collects cluster metrics.
Manual Deployment of Collectors
If you do not want to deploy the collector DaemonSet and pod automatically, then it can be deployed manually with kubectl. If using an older version of Kubernetes than 1.4, you will have to adapt the json files, particularly for the daemonset, and remove some newer features. Please create an issue if you need support for older versions of Kubernetes built in to the app.
The manual deployment instructions and files needed, can be downloaded from the Cluster Config page. At the bottom of the page, there is a help section with instructions and links to all the json files needed.
Uninstalling the Collectors (DaemonSet and Pod)
There is an Undeploy button on the Cluster Config page. To manually undeploy them:
kubectl delete daemonsets -n kube-system snap
kubectl delete deployments -n kube-system snap-kubestate-deployment
kubectl delete configmaps -n kube-system snap-tasks
kubectl delete configmaps -n kube-system snap-tasks-kubestate
Technical Details
Metrics are collected by the Intel Snap collector using the Docker plugin. A DaemonSet with Snap is deployed to your Kubernetes cluster when you add a new cluster in the app. For cluster level metrics, one Snap pod is also deployed to the cluster. The snap_k8s docker image used for this is based off of Intel's Snap docker image.
The following Snap plugins are used to collect metrics:
- CPU Collector
- Docker Collector
- Network Interface Collector
- IOStat Collector
- Load Collector
- MemInfo Collector
- Kubestate Collector
Feedback and Questions
Please submit any issues with the app on Github.
Troubleshooting
If there are any problems with metrics not being collected then you can collect some logs with the following steps:
Get the snap pod (or pods if you have multiple nodes) name with:
kubectl get pods -n kube-systemCheck if the task is running with (replace xxxx with the guid):
kubectl exec -it snap-xxxxx-n kube-system -- /opt/snap/bin/snaptel task listInclude the output in the issue.
Get the logs with:
kubectl logs snap-xxxxx -n kube-systemInclude this output in the issue too.
Grafana Cloud Free
- Free tier: Limited to 3 users
- Paid plans: $55 / user / month above included usage
- Access to all Enterprise Plugins
- Fully managed service (not available to self-manage)
Self-hosted Grafana Enterprise
- Access to all Enterprise plugins
- All Grafana Enterprise features
- Self-manage on your own infrastructure
Install on Grafana Cloud
Plugins can be installed directly from within your Grafana instance or automated using the Cloud API or Terraform.
Learn more about plugin installationMarketplace plugins
This is a paid plugin developed by a marketplace partner. To purchase an entitlement, sign in first, then fill out the contact form.
Get this plugin
This is a paid for plugin developed by a marketplace partner. To purchase entitlement please fill out the contact us form.
What to expect:
- Grafana Labs will reach out to discuss your needs
- Payment will be taken by Grafana Labs
- Once purchased the plugin will be available for you to install (cloud) or a signed version will be provided (on-premise)
Thank you! We will be in touch.
For more information, visit the docs on plugin installation.
Installing on a local Grafana:
For local instances, plugins are installed and updated via a simple CLI command. Plugins are not updated automatically, however you will be notified when updates are available right within your Grafana.
1. Install the Application
Use the grafana-cli tool to install kubernetes from the commandline:
grafana-cli plugins install The plugin will be installed into your grafana plugins directory; the default is /var/lib/grafana/plugins. More information on the cli tool.
Alternatively, you can manually download the .zip file for your architecture below and unpack it into your grafana plugins directory.
Alternatively, you can manually download the .zip file and unpack it into your grafana plugins directory.
2. Enable it
Next, log into your Grafana instance. Navigate to the Plugins section, found in your Grafana main menu.
Click the Apps tabs in the Plugins section and select the newly installed app.
To enable the app, click the Config tab. Follow the instructions provided with the application and click Enable. The app and any new UI pages are now accessible from within the main menu, as designed by the app creator.
If dashboards have been included with the application, they will attempt to be automatically installed. To view the dashboards, re-import or delete individual dashboards, click the Dashboards tab within the app page.