This plugin has been deprecated and is no longer maintained.
Annotations Panel for Grafana
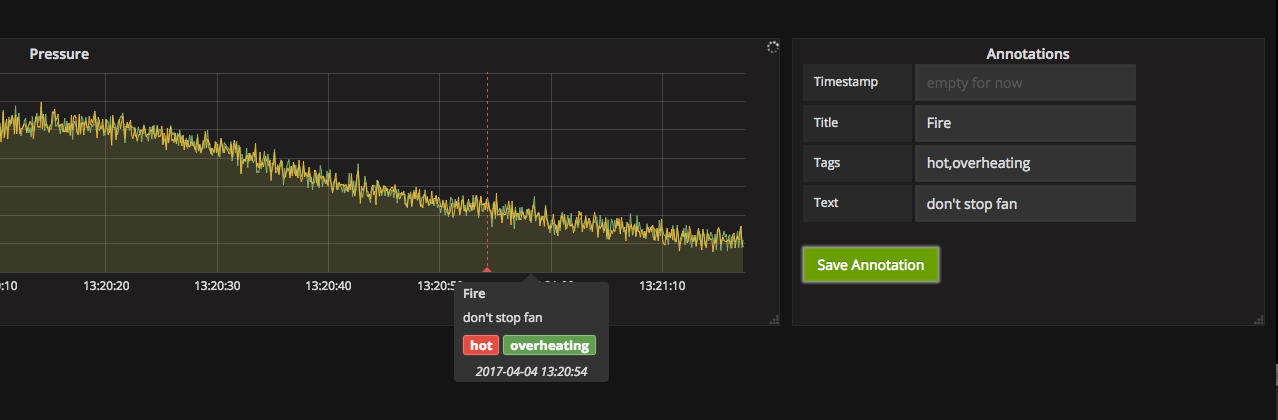
This Grafana panel lets you save annotations in InfluxDB database. It provide a way to mark points on the graph. These points are displayable with InfluxDB Annotations feature.
Screenshots
Panel
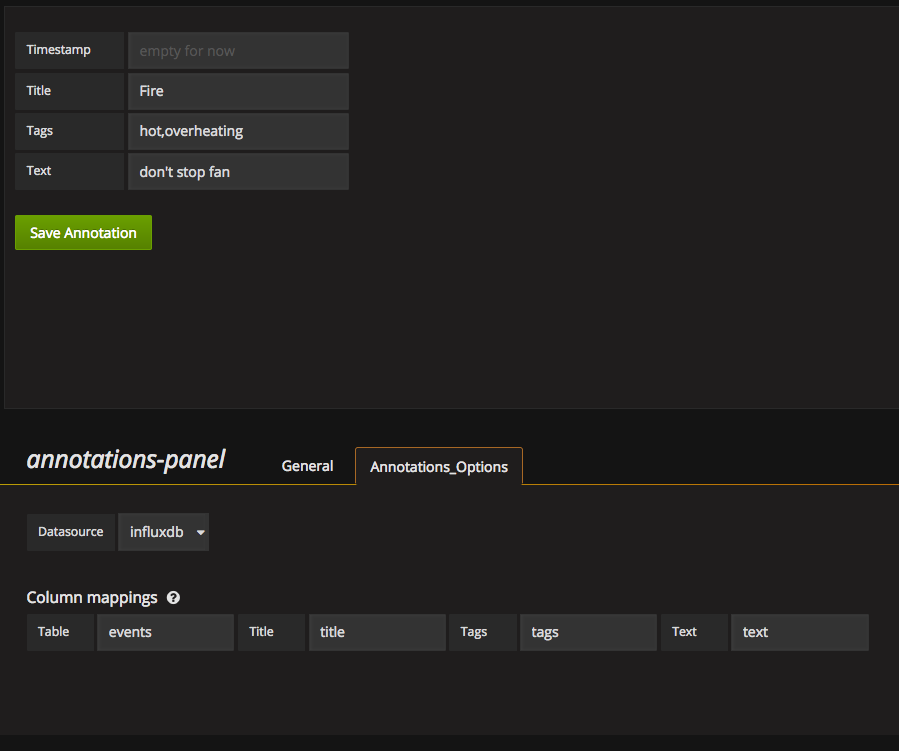
Option Editor
Features
Actually this panel works only with InfluxDB data sources.
Changelog
v0.0.1
- first working version. Only for influxDB
Roadmap
- handle other datasources
Author
- Version
- 0.0.2
- Developer
- novalabsnleali
- Last Updated
- February 4, 2025