Technology partners
Integrate your technology with Grafana and instantly connect your users (and their data) to premium dashboarding, alerting, and monitoring features.
Choose the best method for integrating your technology with Grafana:
Most common
Data Source Plug-In
Data source plugins give users the ability to effortlessly query your data in place through API’s. Contrary to integrations, data source plugins do not require your customers to ingest the data in Grafana Labs backends, which gives you greater control over where your customer data is ingested.
Examples: Influx Datasource, Cognite Data Fusion Data Source, Google Cloud Logging Datasource
Most comprehensive
Application Plug-In
Create an opinionated user experience by combining data sources, out-of the box dashboards, UI extensions, and scenes for the ultimate ease of use, with the same benefit of full control over the customer data. This is how Grafana Labs is delivering our own product experiences.
Examples: Redis App, Azure Cloud Native Monitoring App, AWS IoT TwinMaker App, 3cx App
Most streamlined
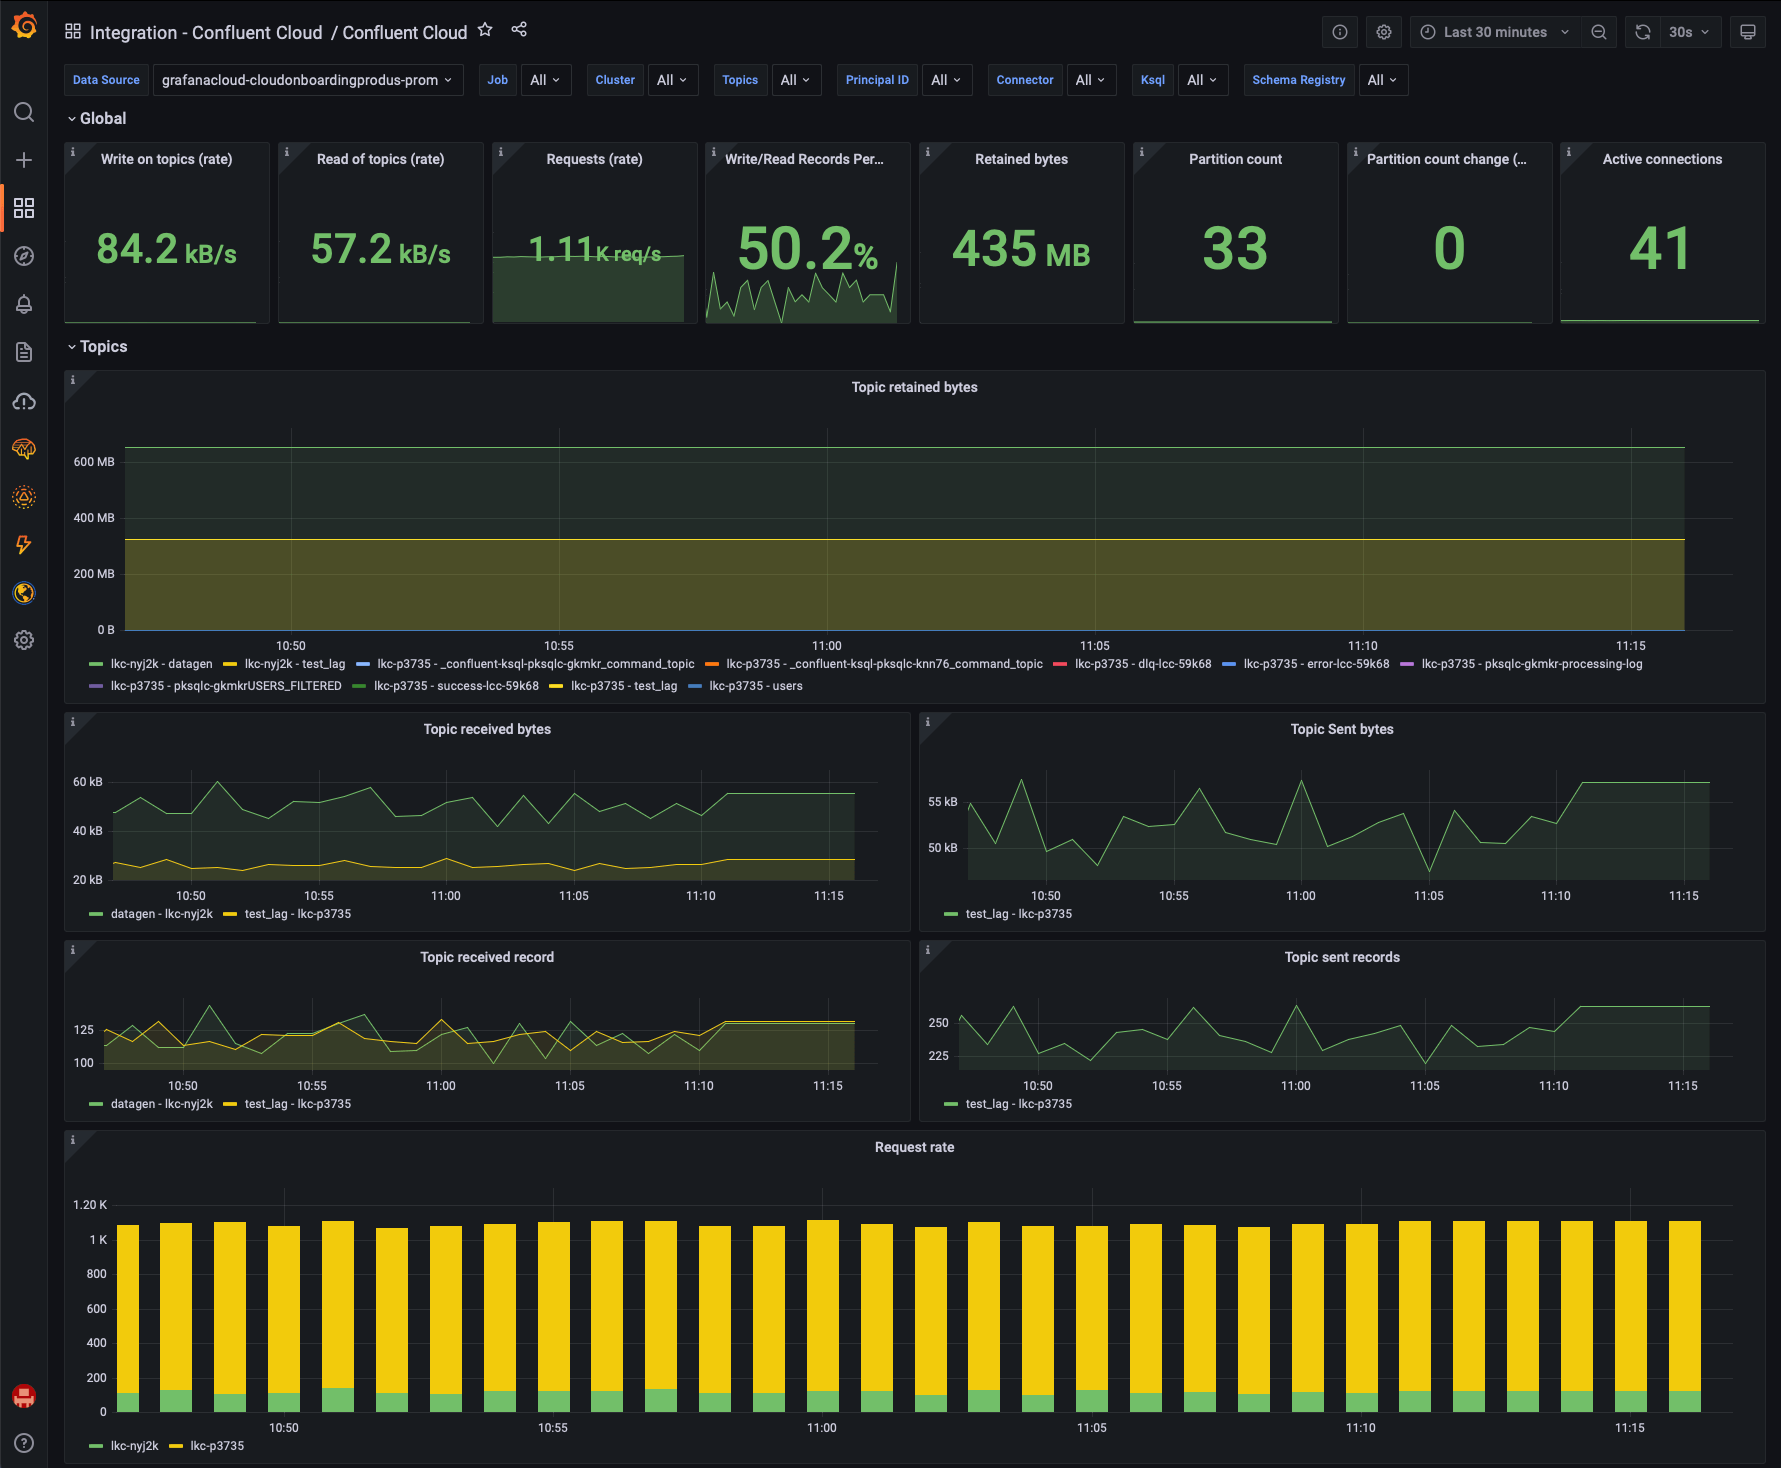
Infrastructure Observability Integration
Give your users the most integrated experience by using Grafana Agent to collect and forward metrics, logs, and traces to Grafana Cloud. This integration ensures full monitoring of your technology’s health and aggregates the data alongside telemetry signals from other platforms and applications.
Examples: Supabase integration, MongoDB integration, Confluent Cloud integration
Not What You’re Looking For?
If your goal is to become a reseller or implementation partner with Grafana Labs please visit Grafana Labs Channel Partner page to connect with our channel team.