Rising interest in OpenTelemetry
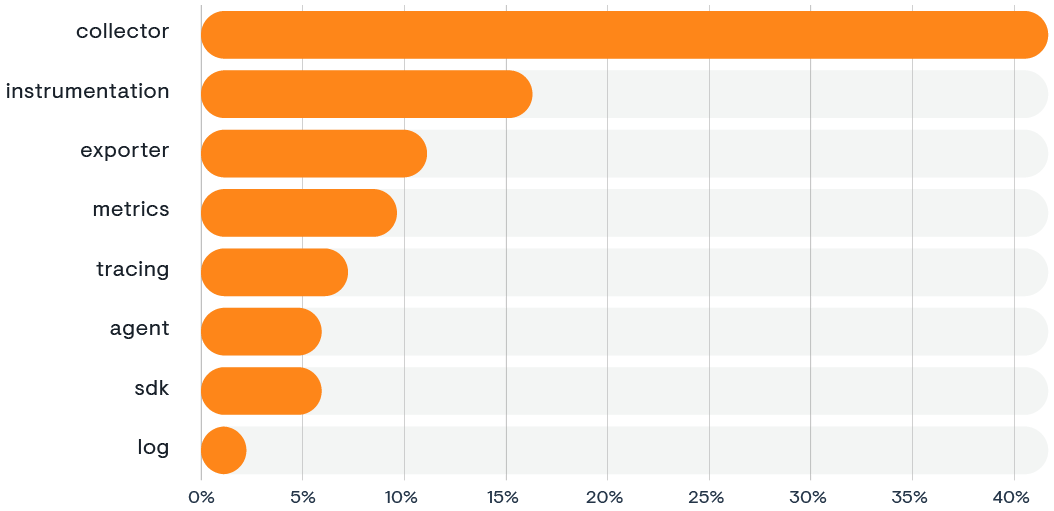
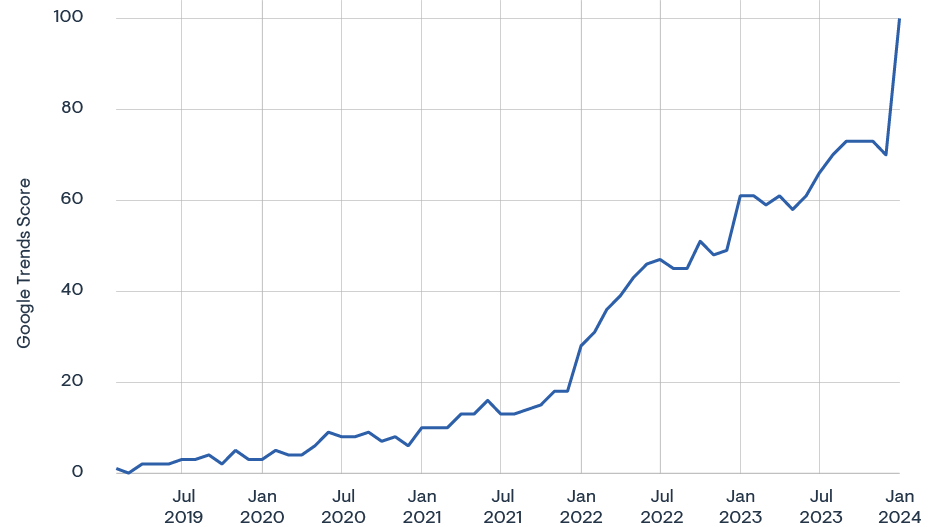
Awareness, interest, and adoption of OpenTelemetry grew fast over the past three years. This is reflected in a wide range of metrics. For example, the number of monthly web searches for OpenTelemetry doubled over the past 12 months. The OpenTelemetry Collector, the component that is used for receiving, processing, and exporting data, receives 45% of the top eight OpenTelemetry-related searches, with “instrumentation” (APIs for infrastructure and app instrumentation) receiving 17%.
Top search terms related to OpenTelemetry
100% increase in web searches year over year
Exploring the top 3 OpenTelemetry search terms
1. Collector
Setting up the Collector and instrumenting the application code and infrastructure are the two critical pre-conditions for achieving optimal observability. For instance, OpenTelemetry provides libraries for instrumenting SQL databases, such as PostgreSQL, MySQL, and Microsoft SQL Server, to collect telemetry data. To instrument a database, you need to connect to the database using the API provided by OpenTelemetry. To simplify this process for developers, OpenTelemetry offers instrumentation libraries for auto-instrumentation and for manual instrumentation. While auto-instrumentation does not require code changes, it does not offer the same level of granular control over the telemetry data output that developers can achieve through manual instrumentation. For example, the auto-instrumentation library for a database query captures the query type, duration, and basic error information, while manual instrumentation can deliver the actual SQL statement, variables, affected rows, and numerous custom metrics, such as cache hits or execution time for different parts of the query. The technology spotlight table below provides ten examples of how automatically extracted data can differ from telemetry data extracted by developers adding instrumentation code.
OpenTelemetry Collector web searches
2. Instrumentation
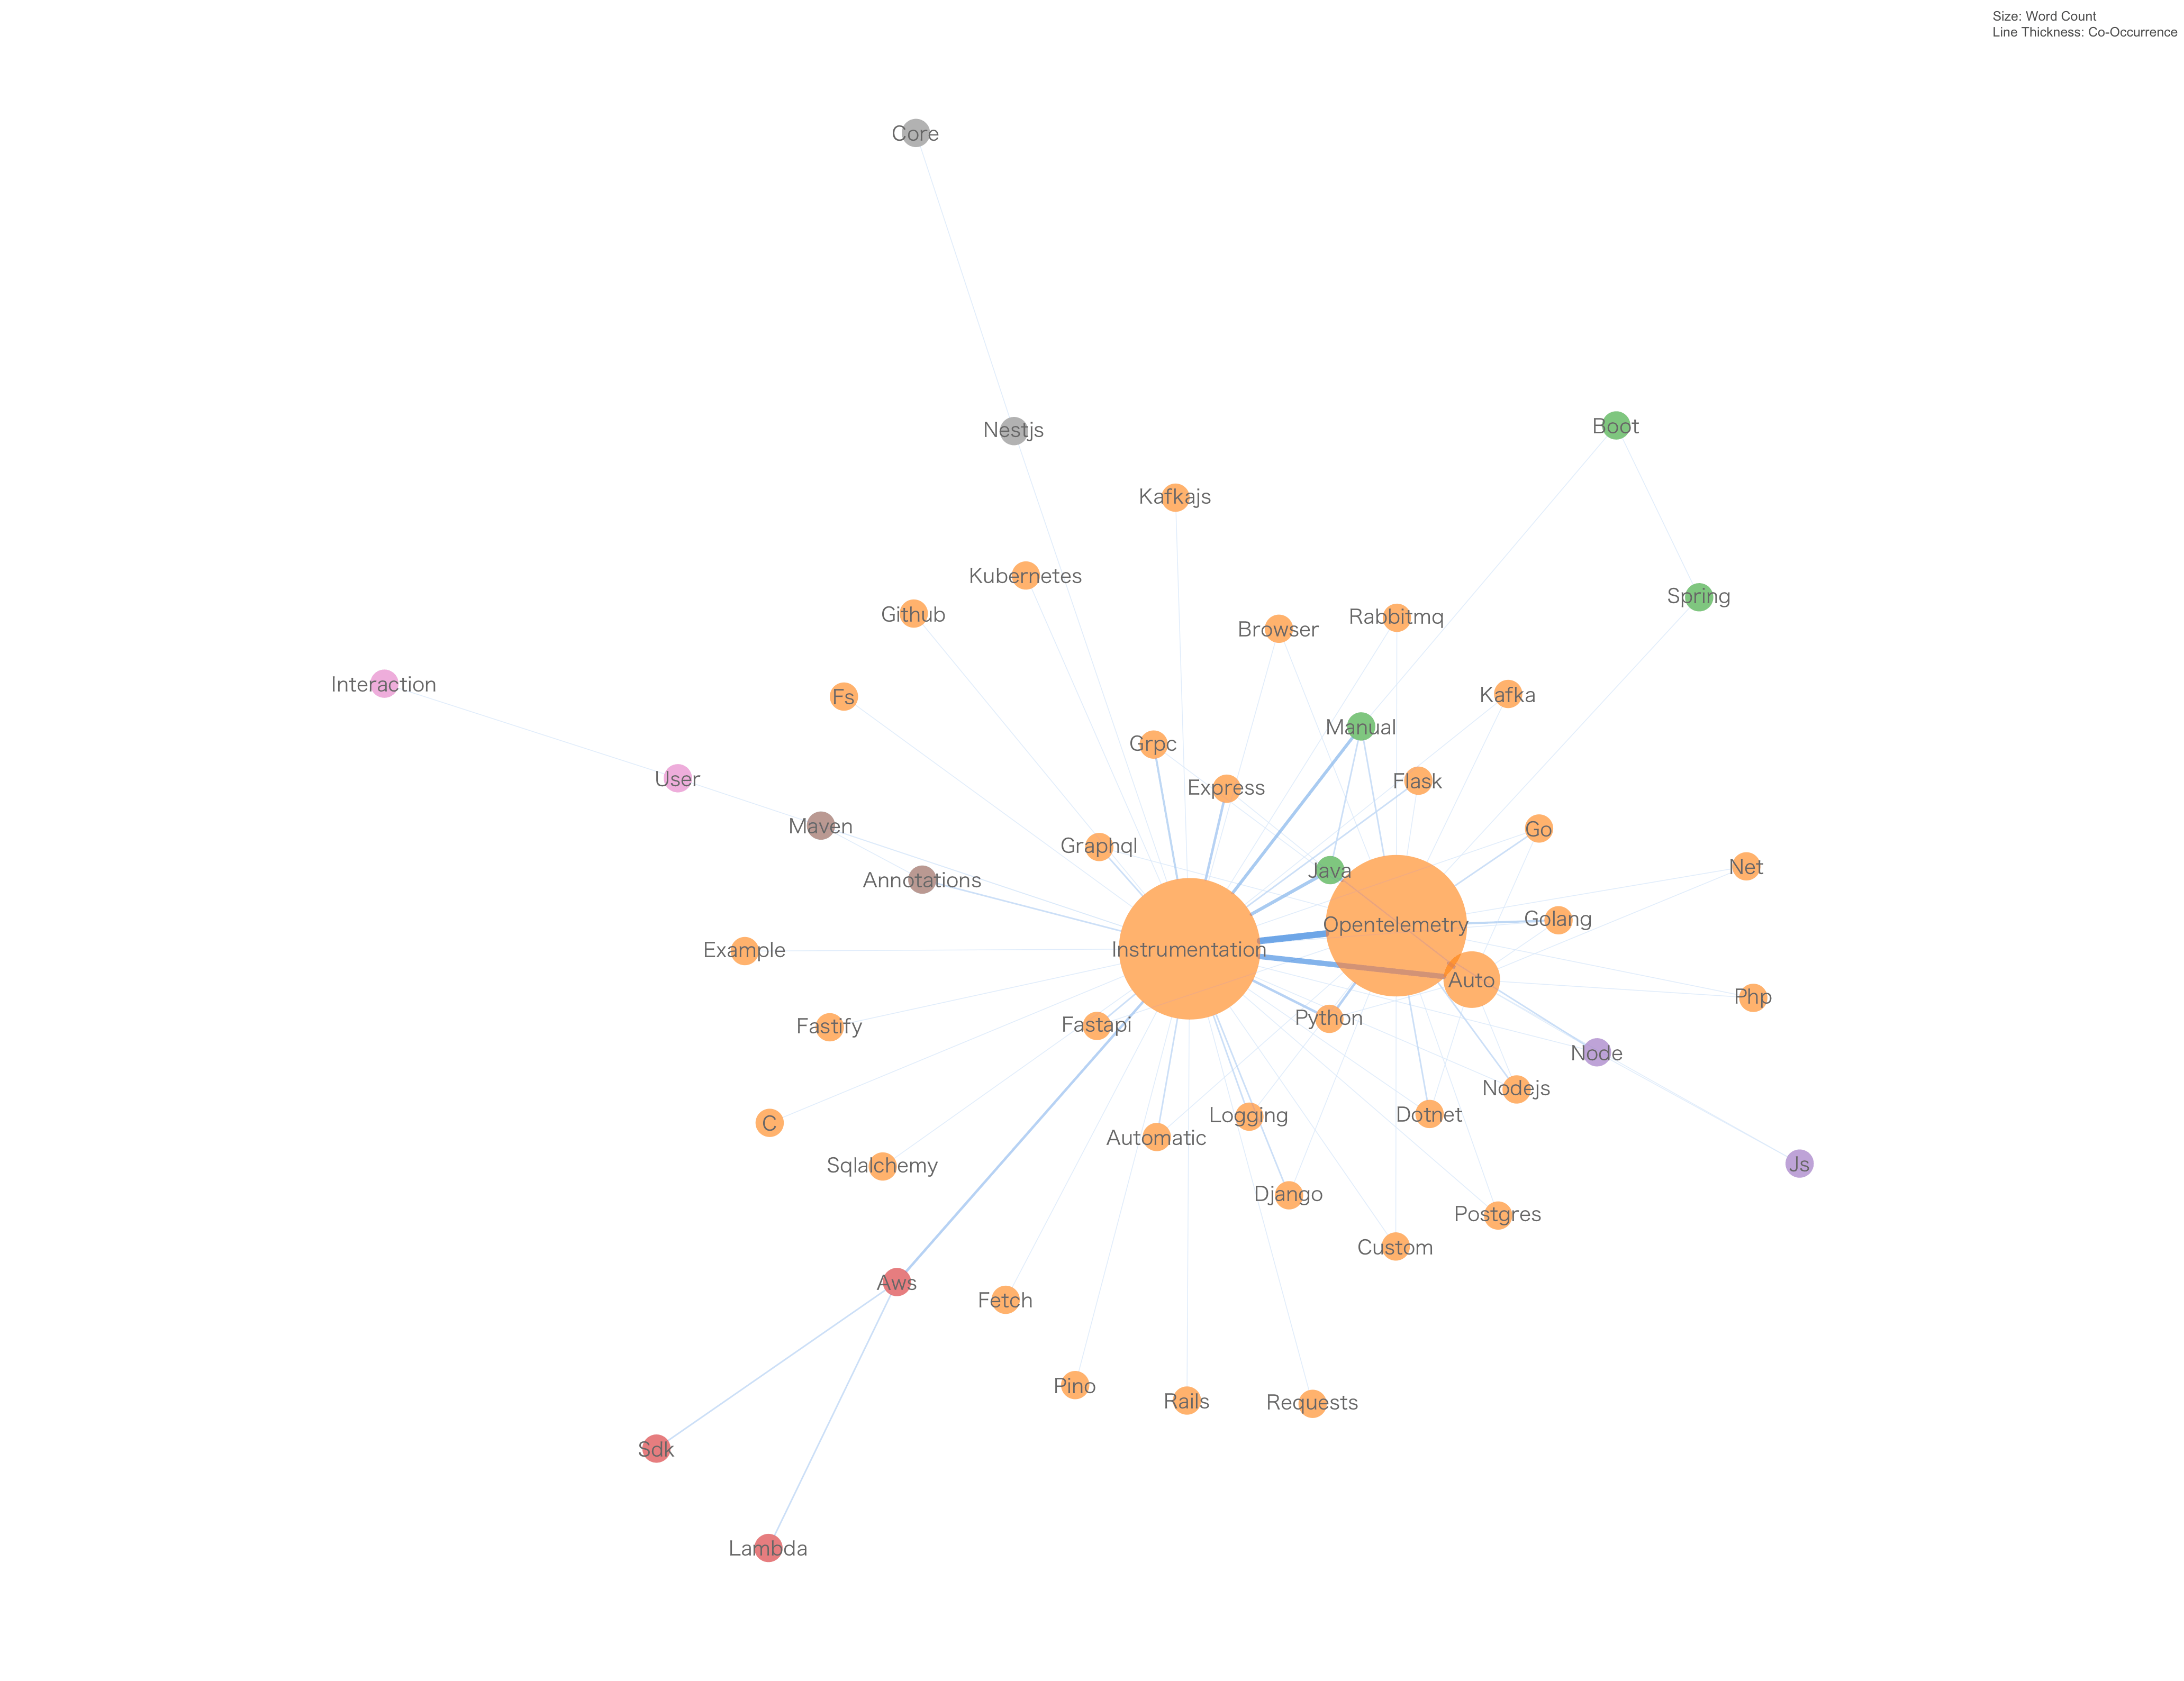
OpenTelemetry Instrumentation web searches
Topic map based on OpenTelemetry Google trends
3. Exporter
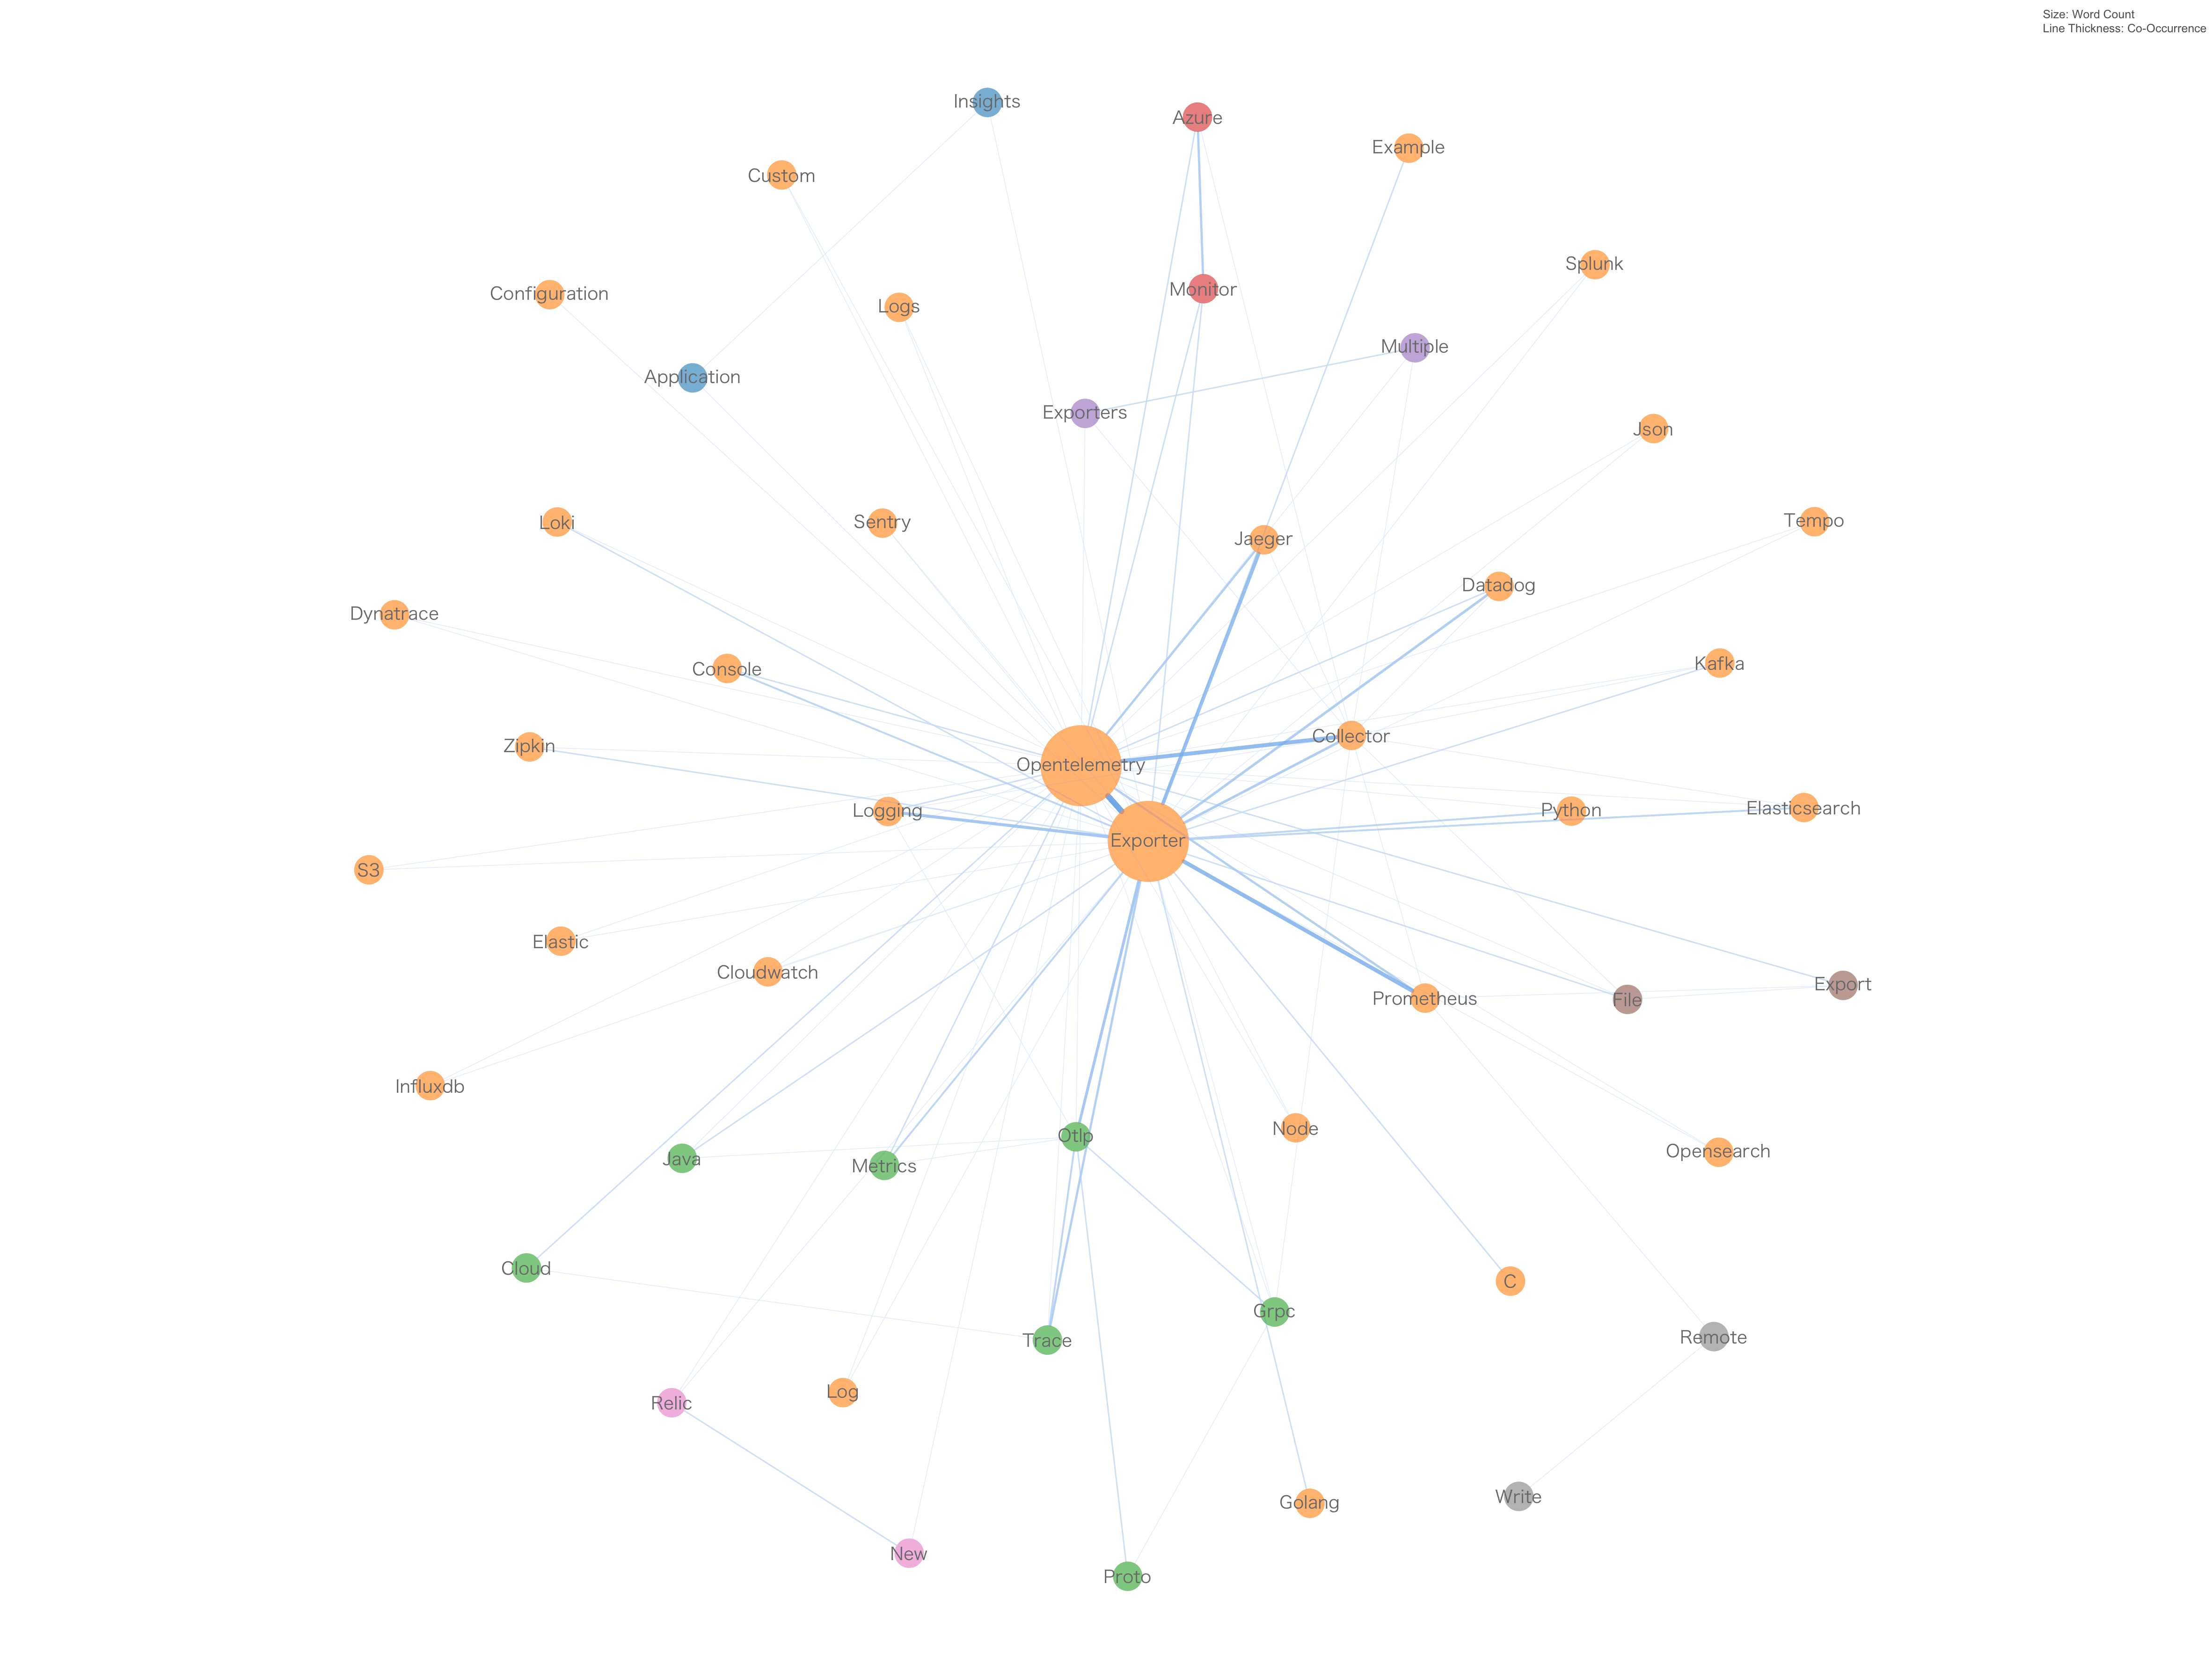
OpenTelemetry Exporter web searches
OpenTelemetry Exporter topic map based on Google Trends
OpenTelemetry spotlight: Auto-instrumentation vs. manual instrumentation
As a general rule, auto-instrumentation libraries are a great starting point for establishing basic observability because they deliver telemetry data without developer involvement. Developers can then add manual instrumentation as needed based on their requirements to better understand app performance, user experience, and health.
OpenTelemetry as part of the cloud native app stack
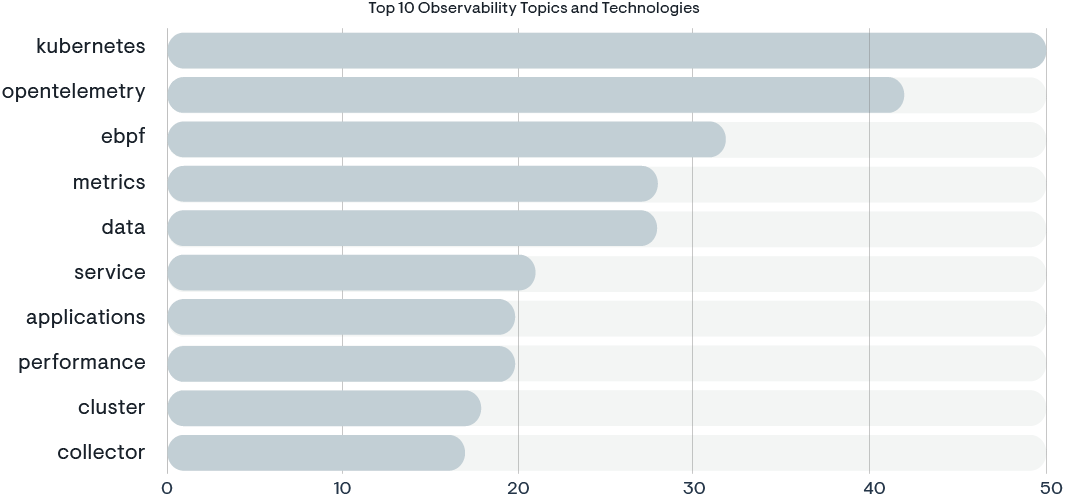
The network graph, based on a complete analysis of all 311 official sessions from the KubeCon 2023 conference in Chicago, illustrates the interconnected nature of various observability topics, with OpenTelemetry at the nexus of numerous key areas, such as service, metrics, and tracing. The proximity and connections between OpenTelemetry and other critical performance and deployment considerations like load balancing, performance, and analytics, reinforce its centrality to the Kubernetes space. This correlation suggests that OpenTelemetry is not just a standalone topic, but is deeply integrated with a range of practices and technologies that are essential for the effective functioning of Kubernetes applications.
The connection between eBPF (extended Berkeley Packet Filter) and OpenTelemetry, as seen in the charts, is particularly noteworthy. eBPF appears as the third-most important topic in the bar chart, indicating a high level of interest and relevance in the context of Kubernetes observability. Given eBPF’s capabilities for providing low-level system tracing and network traffic monitoring without modifying the kernel or installing additional modules, it is a powerful tool for observability. When integrated with OpenTelemetry, eBPF can enhance the telemetry data collected, allowing for more sophisticated and fine- grained observability solutions. This pairing enables developers and operators to not only observe their systems with minimal performance overhead, but also to gather insights at a granular level that eBPF provides, thereby significantly improving the observability and troubleshooting of Kubernetes applications.
The charts suggest that the synergy between eBPF and OpenTelemetry is recognized by the community as a valuable combination for achieving deeper system visibility and advanced performance analysis.
Top 10 observability topics at KubeCON 2023 in Chicago
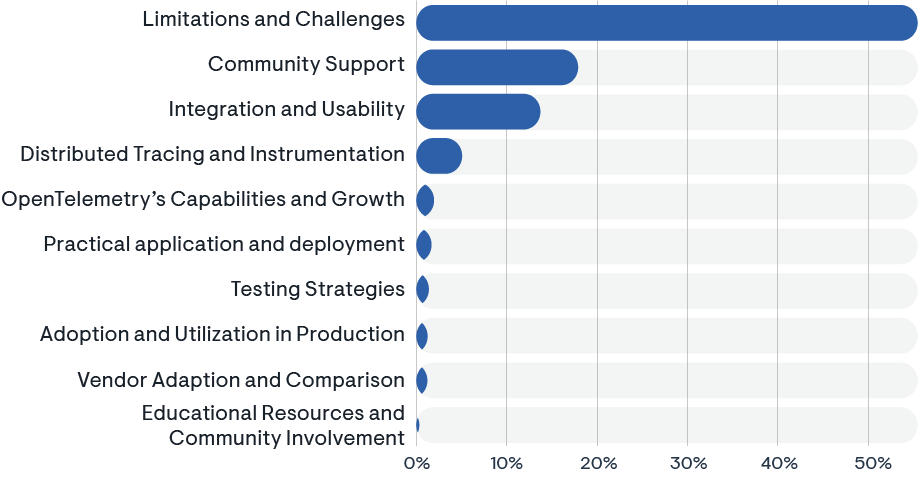
Top 10 OpenTelemetry topics across Subreddits: The Good, the Bad, and the Ugly
Leveraging the GPT-4 large language model (LLM) to extract the 10 key themes across 1,000 posts from all 221 Subreddits that discuss OpenTelemetry, we find that “limitations and challenges” is the No. 1 topic.
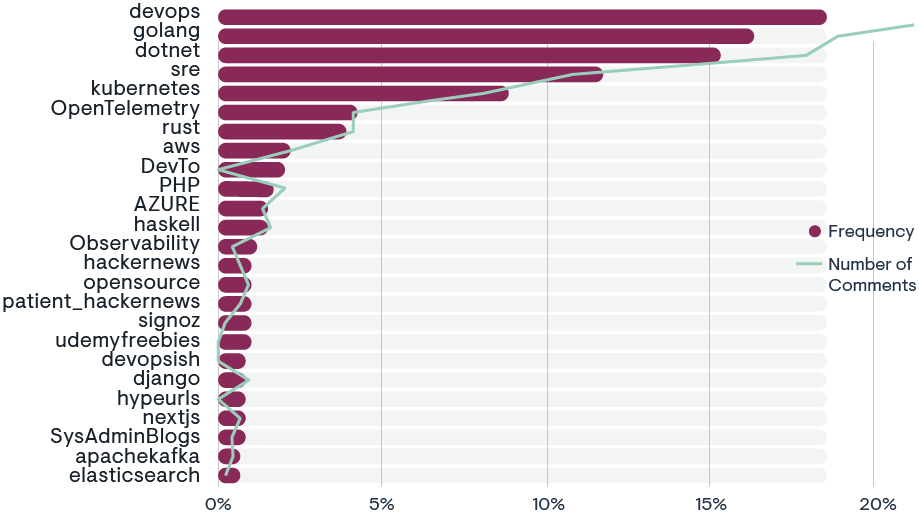
Top 25 Subreddits discussing OpenTelemetry
This is not surprising since a) OpenTelemetry is still a new platform with a currently rapid adoption rate and b) professionals often post to Reddit to seek advice or even vent their displeasure. Keeping this in mind, there are still many interesting and productive lessons we can learn by analyzing the 10 key topics gleaned from the 1,000 posts we analyzed.
1. Adoption and Utilization in Production: Organizations are seeking to move their OpenTelemetry deployments from an experimental status into production. OpenTelemetry aims to become the standard for how telemetry data is gathered, processed, and exported across infrastructure and applications in the data center, the cloud, and at the edge. Adopting one standard for observability across teams enables organizations to save on costs and resources, streamline their monitoring processes, and reduce the complexity associated with managing multiple observability tools. This standardization also facilitates better collaboration and knowledge sharing among teams, leading to more efficient problem-solving and a more cohesive understanding of system performance across the entire organization. Moreover, with a unified approach, organizations can leverage deeper insights and more meaningful data correlations, thereby improving decision-making and operational agility in a rapidly evolving technological landscape.
2. Distributed tracing and instrumentation: Active discussion focus on distributed tracing in microservices, emphasizing proper instrumentation, integration with different backends, and trace data optimization. Solutions for trace propagation in contexts like Amazon SQS are also explored. These discussions are pivotal for enhancing performance monitoring and debugging in complex distributed systems.
3. Vendor adaptation and comparison: OpenTelemetry’s vendor-agnostic nature is a major strength. Discussions involve how different observability platforms integrate with OpenTelemetry, offering flexibility and varied choices for developers. This adaptability empowers organizations to customize their observability stacks according to their specific needs.
4. Community support and resource sharing: The community actively shares tutorials, blog posts, and documentation alongside community calls and meetups, fostering a collaborative learning environment. This culture of sharing not only accelerates the adoption of OpenTelemetry, but also enriches the collective knowledge base.
5. Testing strategies: Exploration of testing methods for OpenTelemetry and instrumented systems, including black-box and trace-based approaches, to ensure reliable releases and maintainability. These strategies are crucial for maintaining high-quality standards in software releases and continuous deployment pipelines.
6. Limitations and challenges: Communication of limitations and the need for improvements in areas like metric export configuration, logging integration, and trace data management. Addressing these challenges is key to enhancing the scalability and reliability of OpenTelemetry in large-scale environments.
7. OpenTelemetry’s capabilities and growth: Outlining OpenTelemetry’s capabilities in collecting traces, logs, and metrics, and noting its growth and industry recognition. Its evolving nature and industry adoption make it a cornerstone technology in the future of cloud native observability.
8. Integration and usability: Emphasis on OpenTelemetry as a comprehensive open source framework that standardizes telemetry across languages and supports various backend services, enhancing observability and monitoring. This integration capability is crucial for ensuring seamless observability across polyglot application environments.
9. Practical application and deployment: Demonstrating real-world uses in production environments, with effective integration with tools like Kubernetes and Istio, showcasing its practical value in technical operations. These real-world implementations highlight OpenTelemetry’s role in simplifying complex observability challenges in modern infrastructures.
10. Educational resources and community involvement: Highlighting the demand for educational content and community engagement to navigate the complexity of OpenTelemetry and contribute to its development and refinement. The active participation of the community is instrumental in driving the continuous evolution and usability of OpenTelemetry.
Top 10 OpenTelemetry topics on Reddit
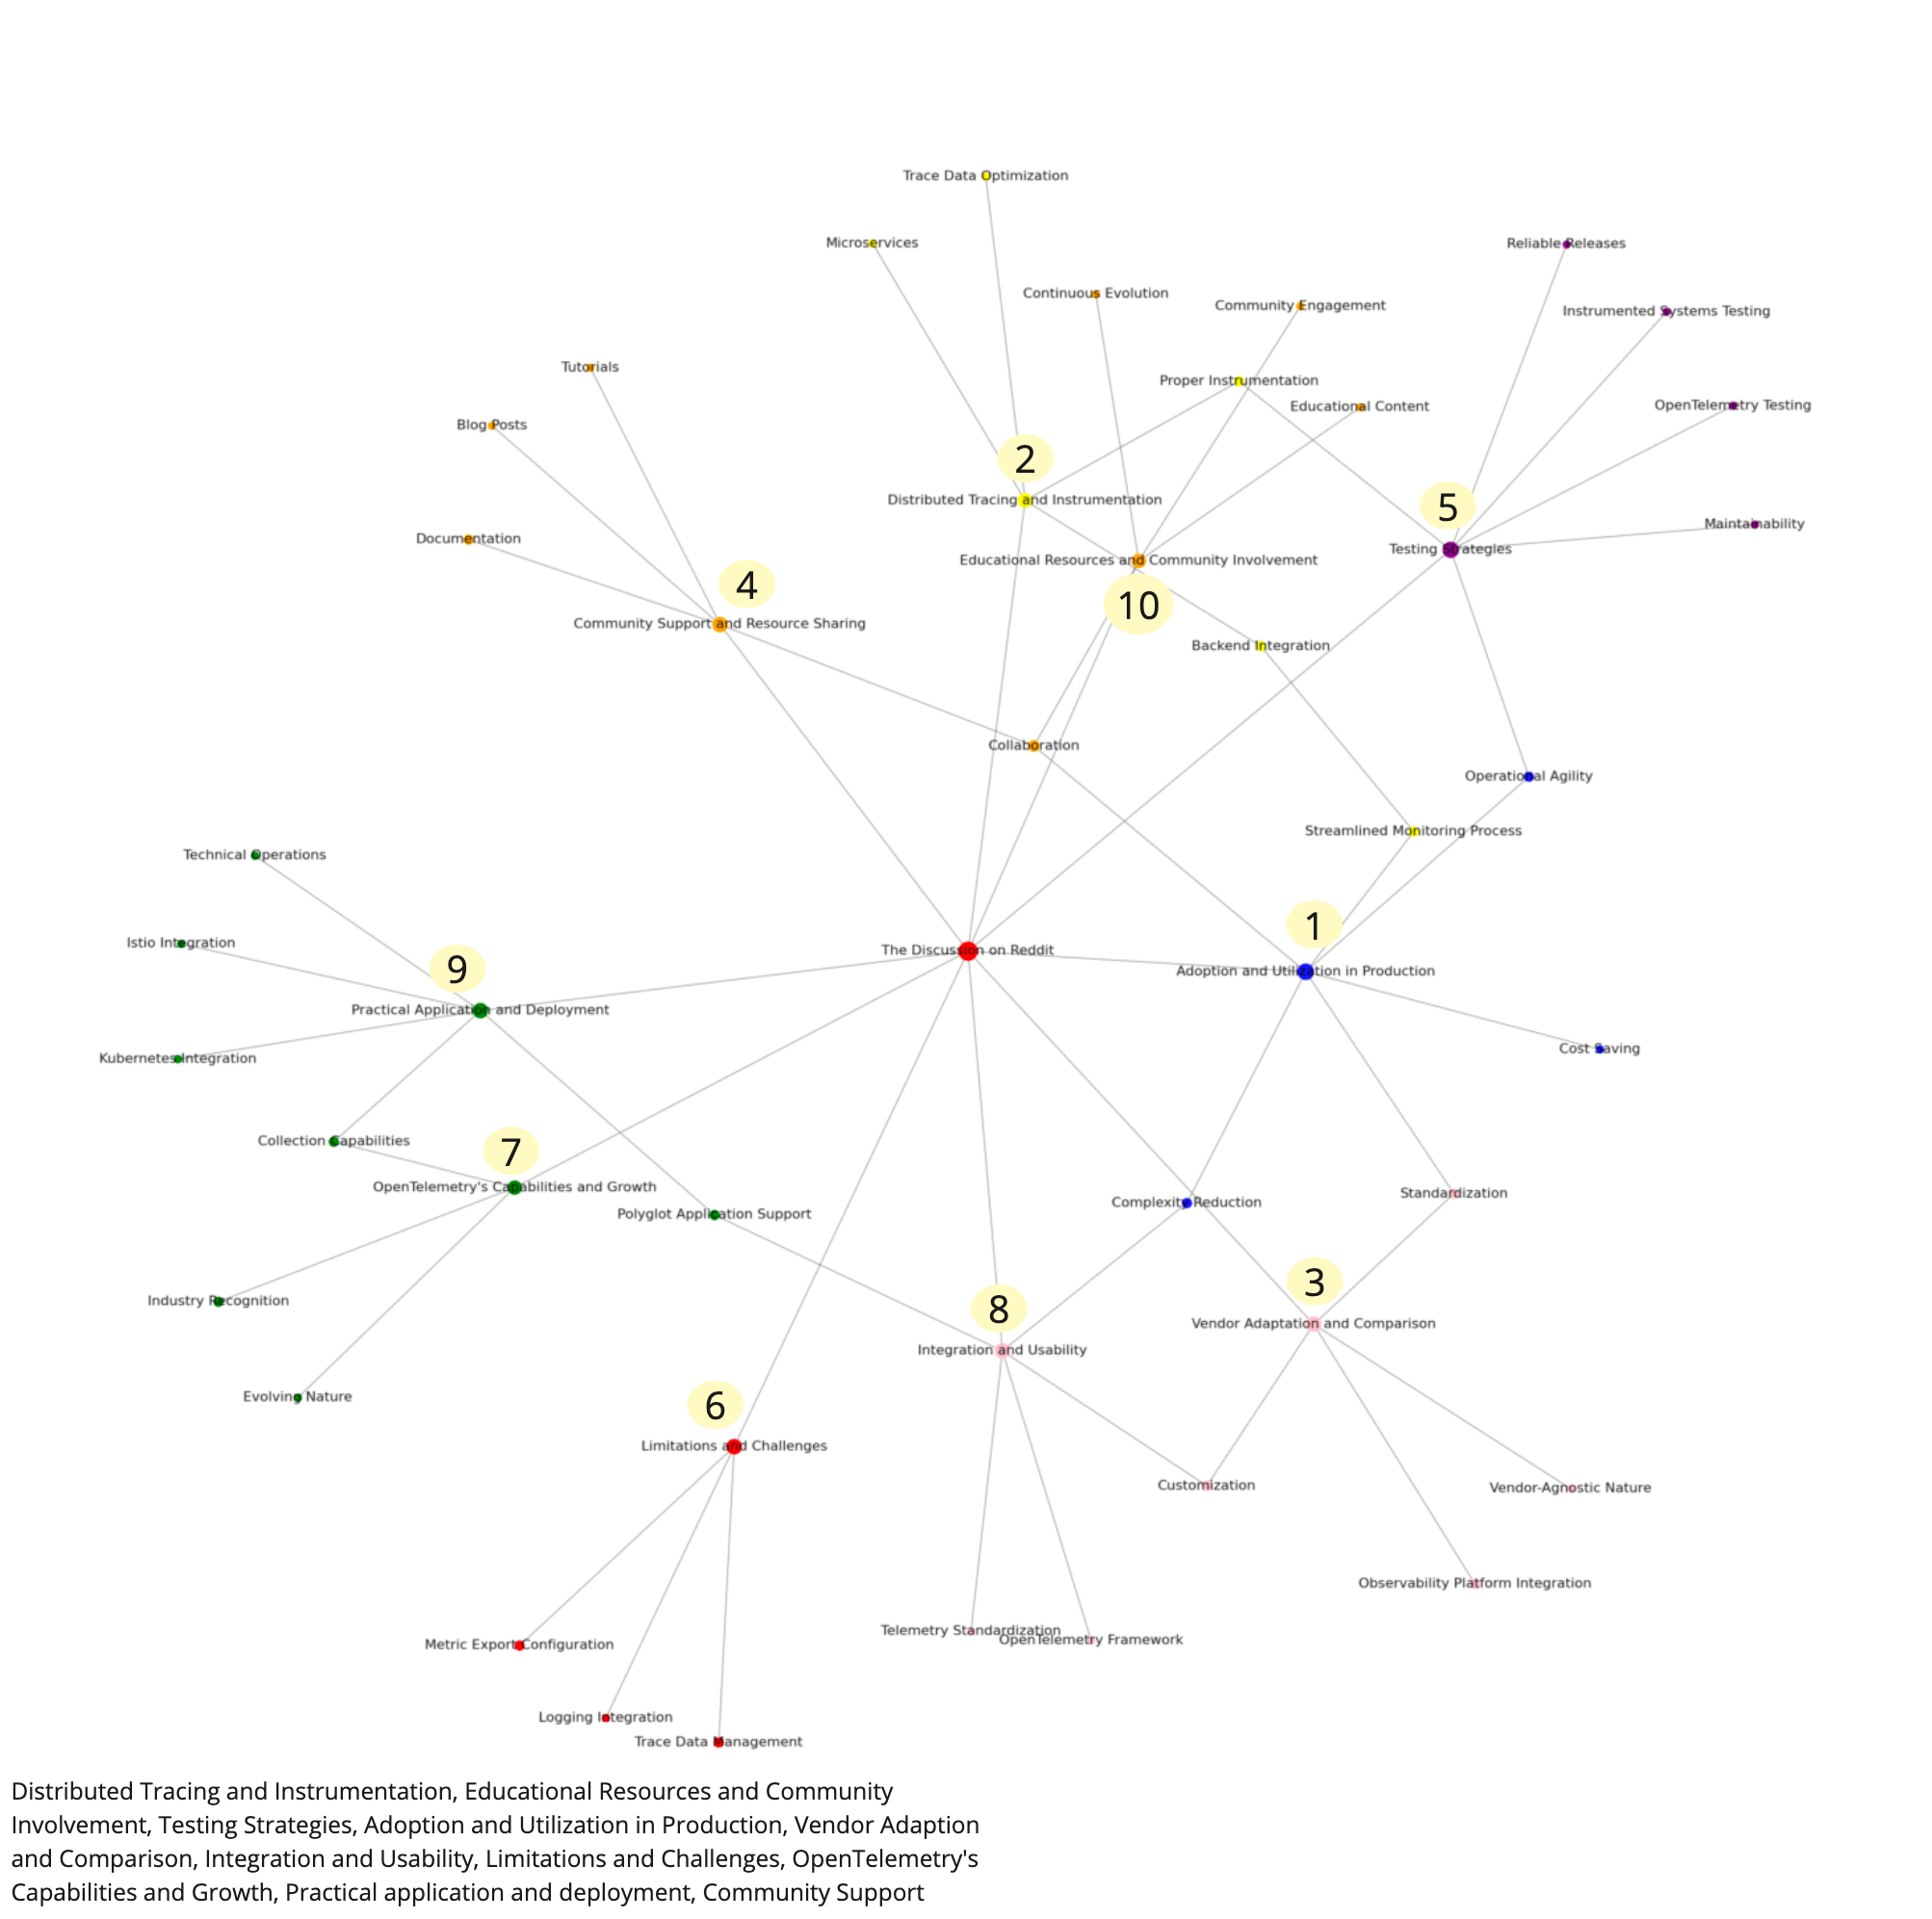
The analysis of the top ten OpenTelemetry discussions on Reddit reveals that enterprises are actively navigating the complexities of integrating this new software platform. Despite the enthusiasm, the transition is challenging due to limited production experience and insufficient documentation. Moreover, the novelty of some parts of the codebase adds to the difficulty. The full potential of OpenTelemetry is realized only when it is deeply integrated with existing enterprise systems, which is a nuanced process that organizations are currently working to master.
Business perspective
The word cloud (below) derived from the Hacker News forum discussions (1,350 posts) about OpenTelemetry offers insights into the interests and priorities of Hacker News participants, including technologists, entrepreneurs, and investors. The prominence of terms like tracing and metrics reflects a keen interest in the technical aspects of monitoring and managing cloud native applications. This focus is particularly relevant for investors and tech leaders who are looking to understand the operational health and performance of software systems, since these are critical factors in risk assessment and decision-making for technology investments.
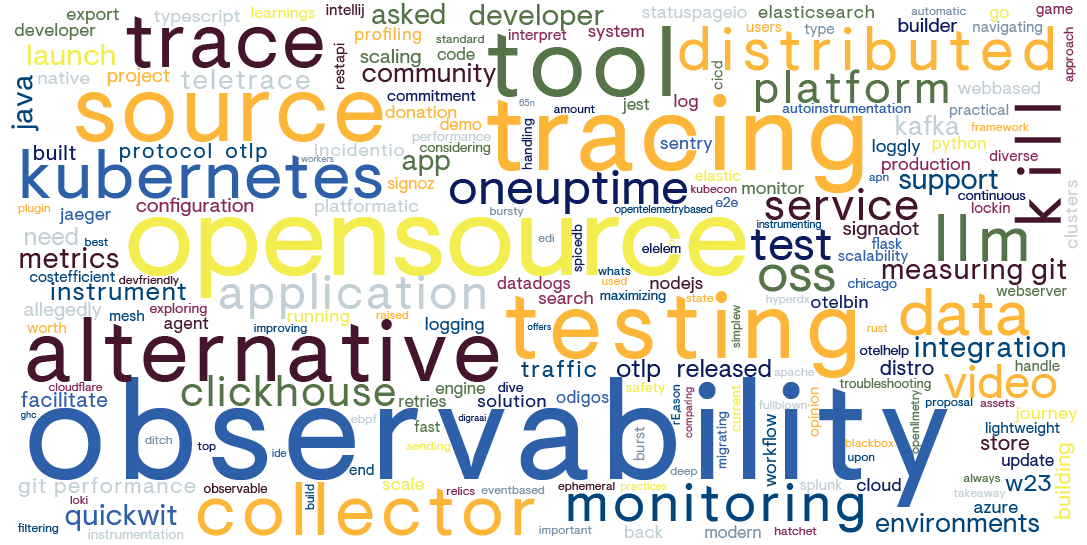
Top 10 OpenTelemetry-related topics on Hacker News
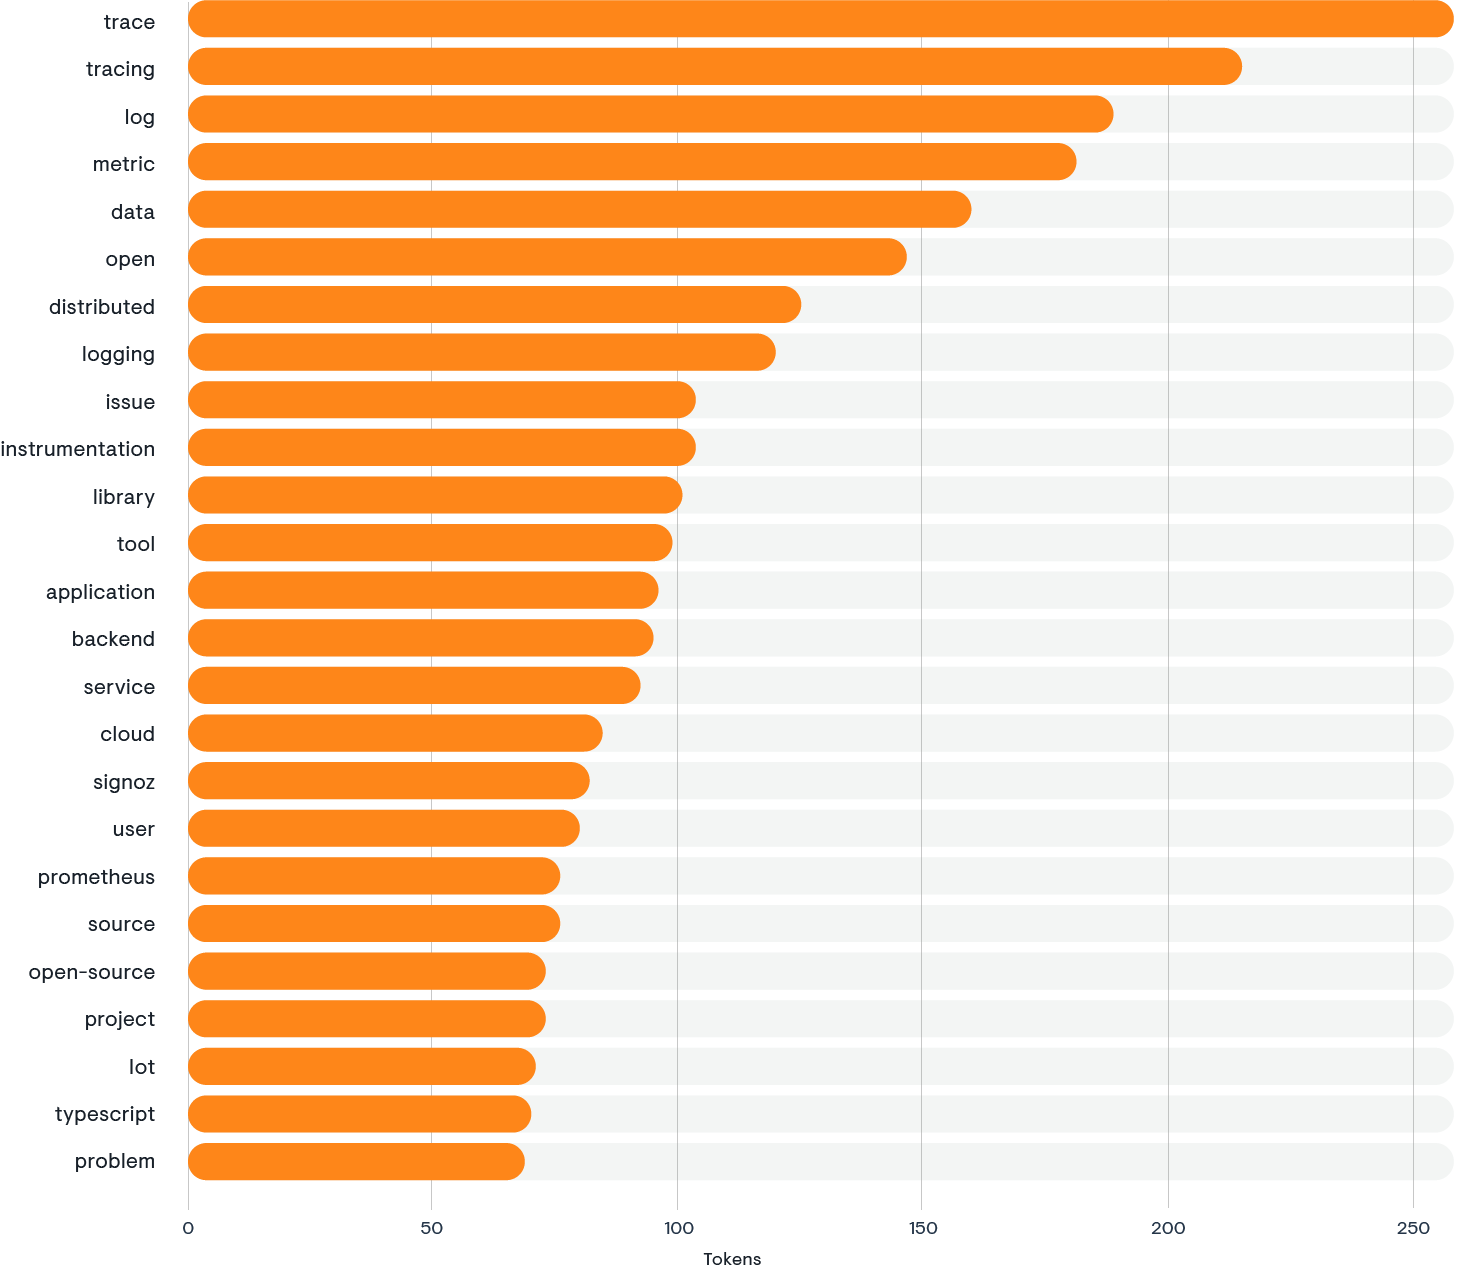
The inclusion of specific technologies, such as Kubernetes, Datadog, Java, Python, and AWS in the word cloud, indicates that the discussions are grounded in real-world applications and integrations. This suggests that the Hacker News community is not only interested in the theoretical aspects of OpenTelemetry, but also in its practical implementation across various platforms and languages. For higher-level tech individuals and investors, this translates into a rich source of information on how OpenTelemetry can be leveraged to enhance observability within the technology stacks they are using or considering for investment.
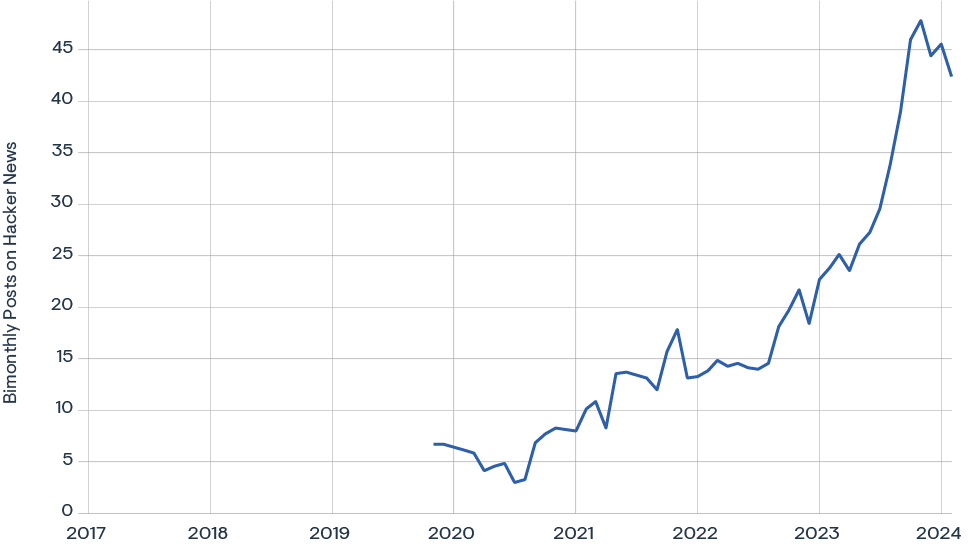
100% increase YoY in Hacker News posts related to OpenTelemetry
Lastly, the presence of terms like open source, community, support, and integration highlights the collaborative nature of the OpenTelemetry project and its ecosystem. This underscores the value of community-driven innovation and the potential for long-term sustainability and support for the technology. The term collector points to specific discussions about the OpenTelemetry Collector, which is of interest to those looking to understand the technical underpinnings and capabilities of the project. Overall, the word cloud suggests that the Hacker News forum is a hub for high-level discourse on OpenTelemetry, offering insights that are valuable to both the technical and investment-oriented members of the community.
