How OpenTelemetry works
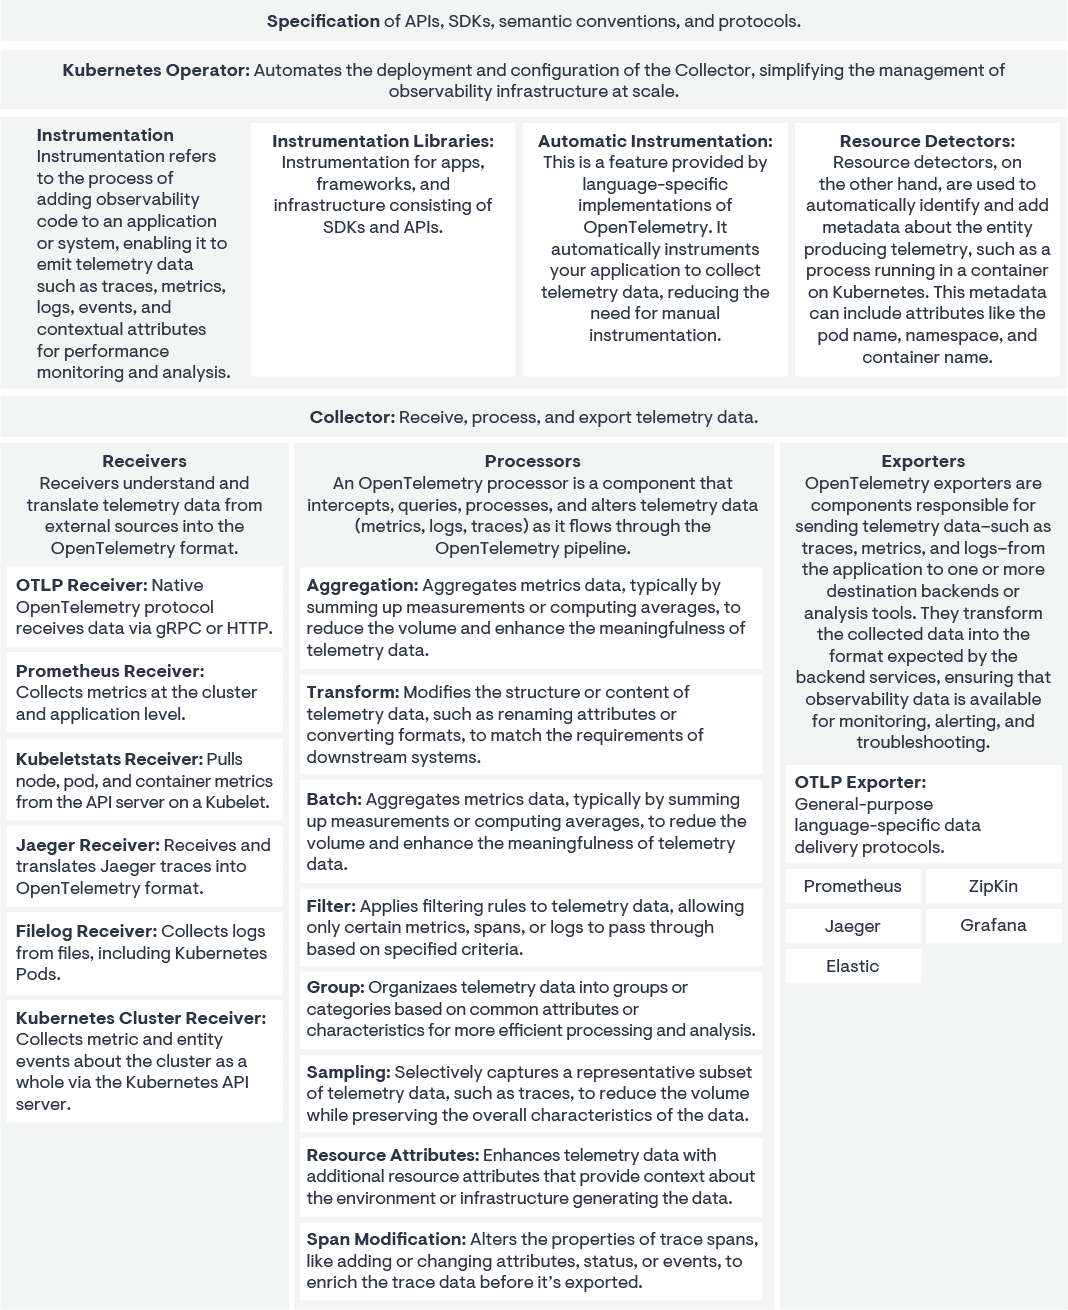
OpenTelemetry consists of six core elements.
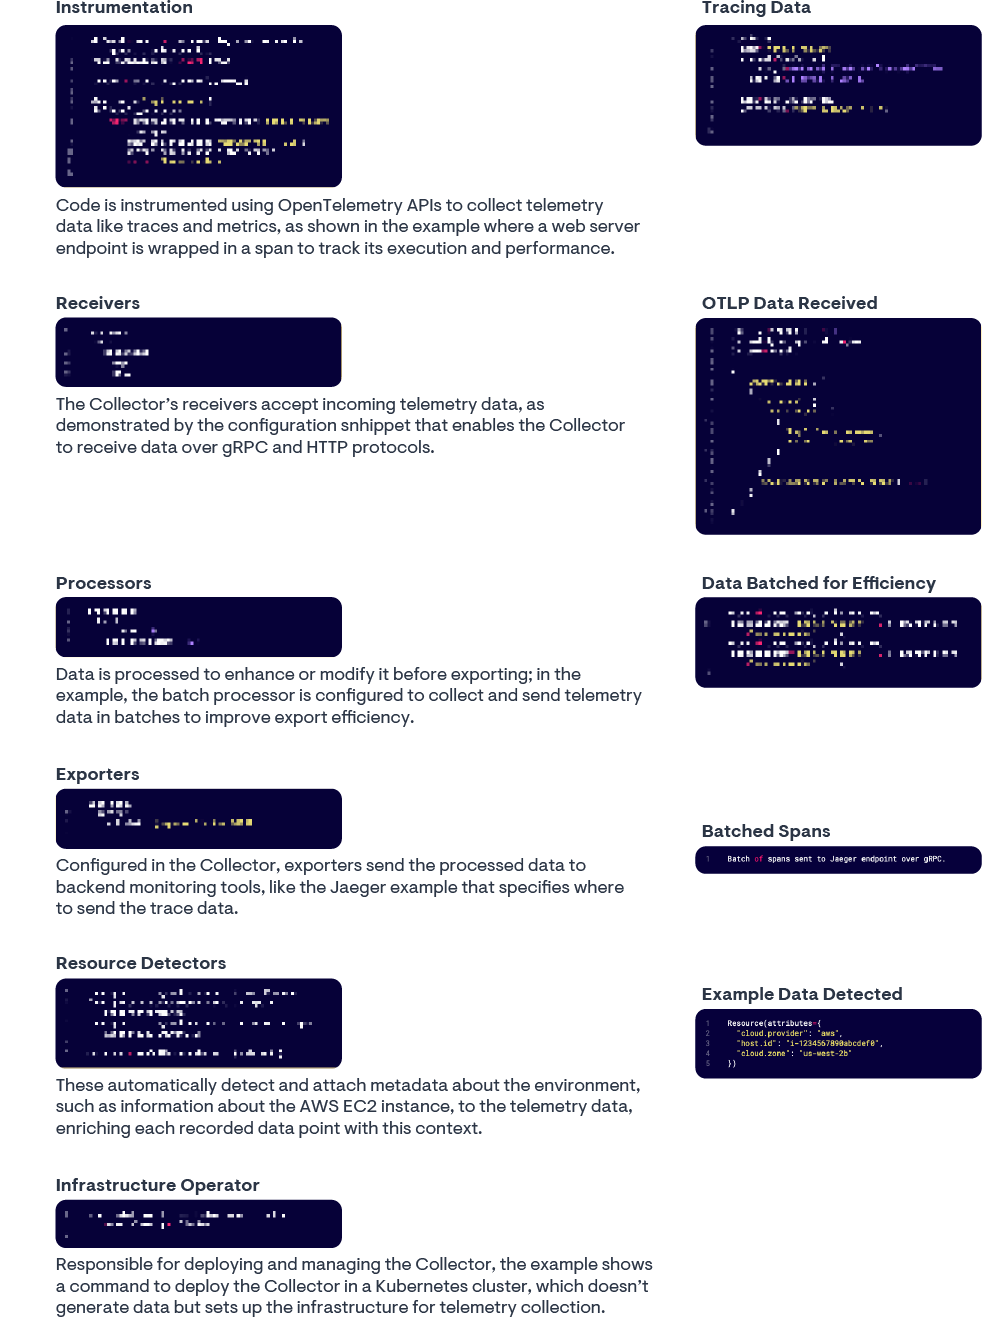
- Instrumentation libraries. Instrumentation libraries enhance applications with the ability to generate telemetry data, such as traces, metrics, and logs. For example, a web application can be instrumented to track the number of requests it receives, response times for each request, and log any errors that occur during request handling.
- Receivers. These components are responsible for collecting the telemetry data from various sources. An example would be an OTLP (OTLP is the OpenTelemetry protocol for efficient telemetry data transmission) receiver configured in the OpenTelemetry Collector to receive data over gRPC or HTTP protocols from instrumented applications.
- Processors. Once data is received, it can be processed in various ways before exporting. For instance, a batch processor may be used to aggregate trace data and reduce the number of outgoing calls by bundling multiple spans into a single batch.
- Exporters. The processed data is then forwarded to backend systems for analysis and monitoring. As an example, an exporter could send processed trace data to a backend like Jaeger for distributed tracing visualization.
- Resource detectors. These automatically identify information about where the telemetry data is coming from, adding context and metadata. For instance, a Kubernetes resource detector can automatically tag telemetry data with the pod and node name from which it originates.
- Infrastructure operator. This component handles the deployment, management, and upgrades of the OpenTelemetry Collector. The infrastructure operator continuously ensures the correct setup of the Collector for receiving data from instrumented services and sending it to the appropriate backend systems.
The overall workflow of OpenTelemetry is designed to be flexible and extensible, allowing developers to choose and configure each component according to their specific observability needs.
Components of OpenTelemetry

12 common data sources for OpenTelemetry
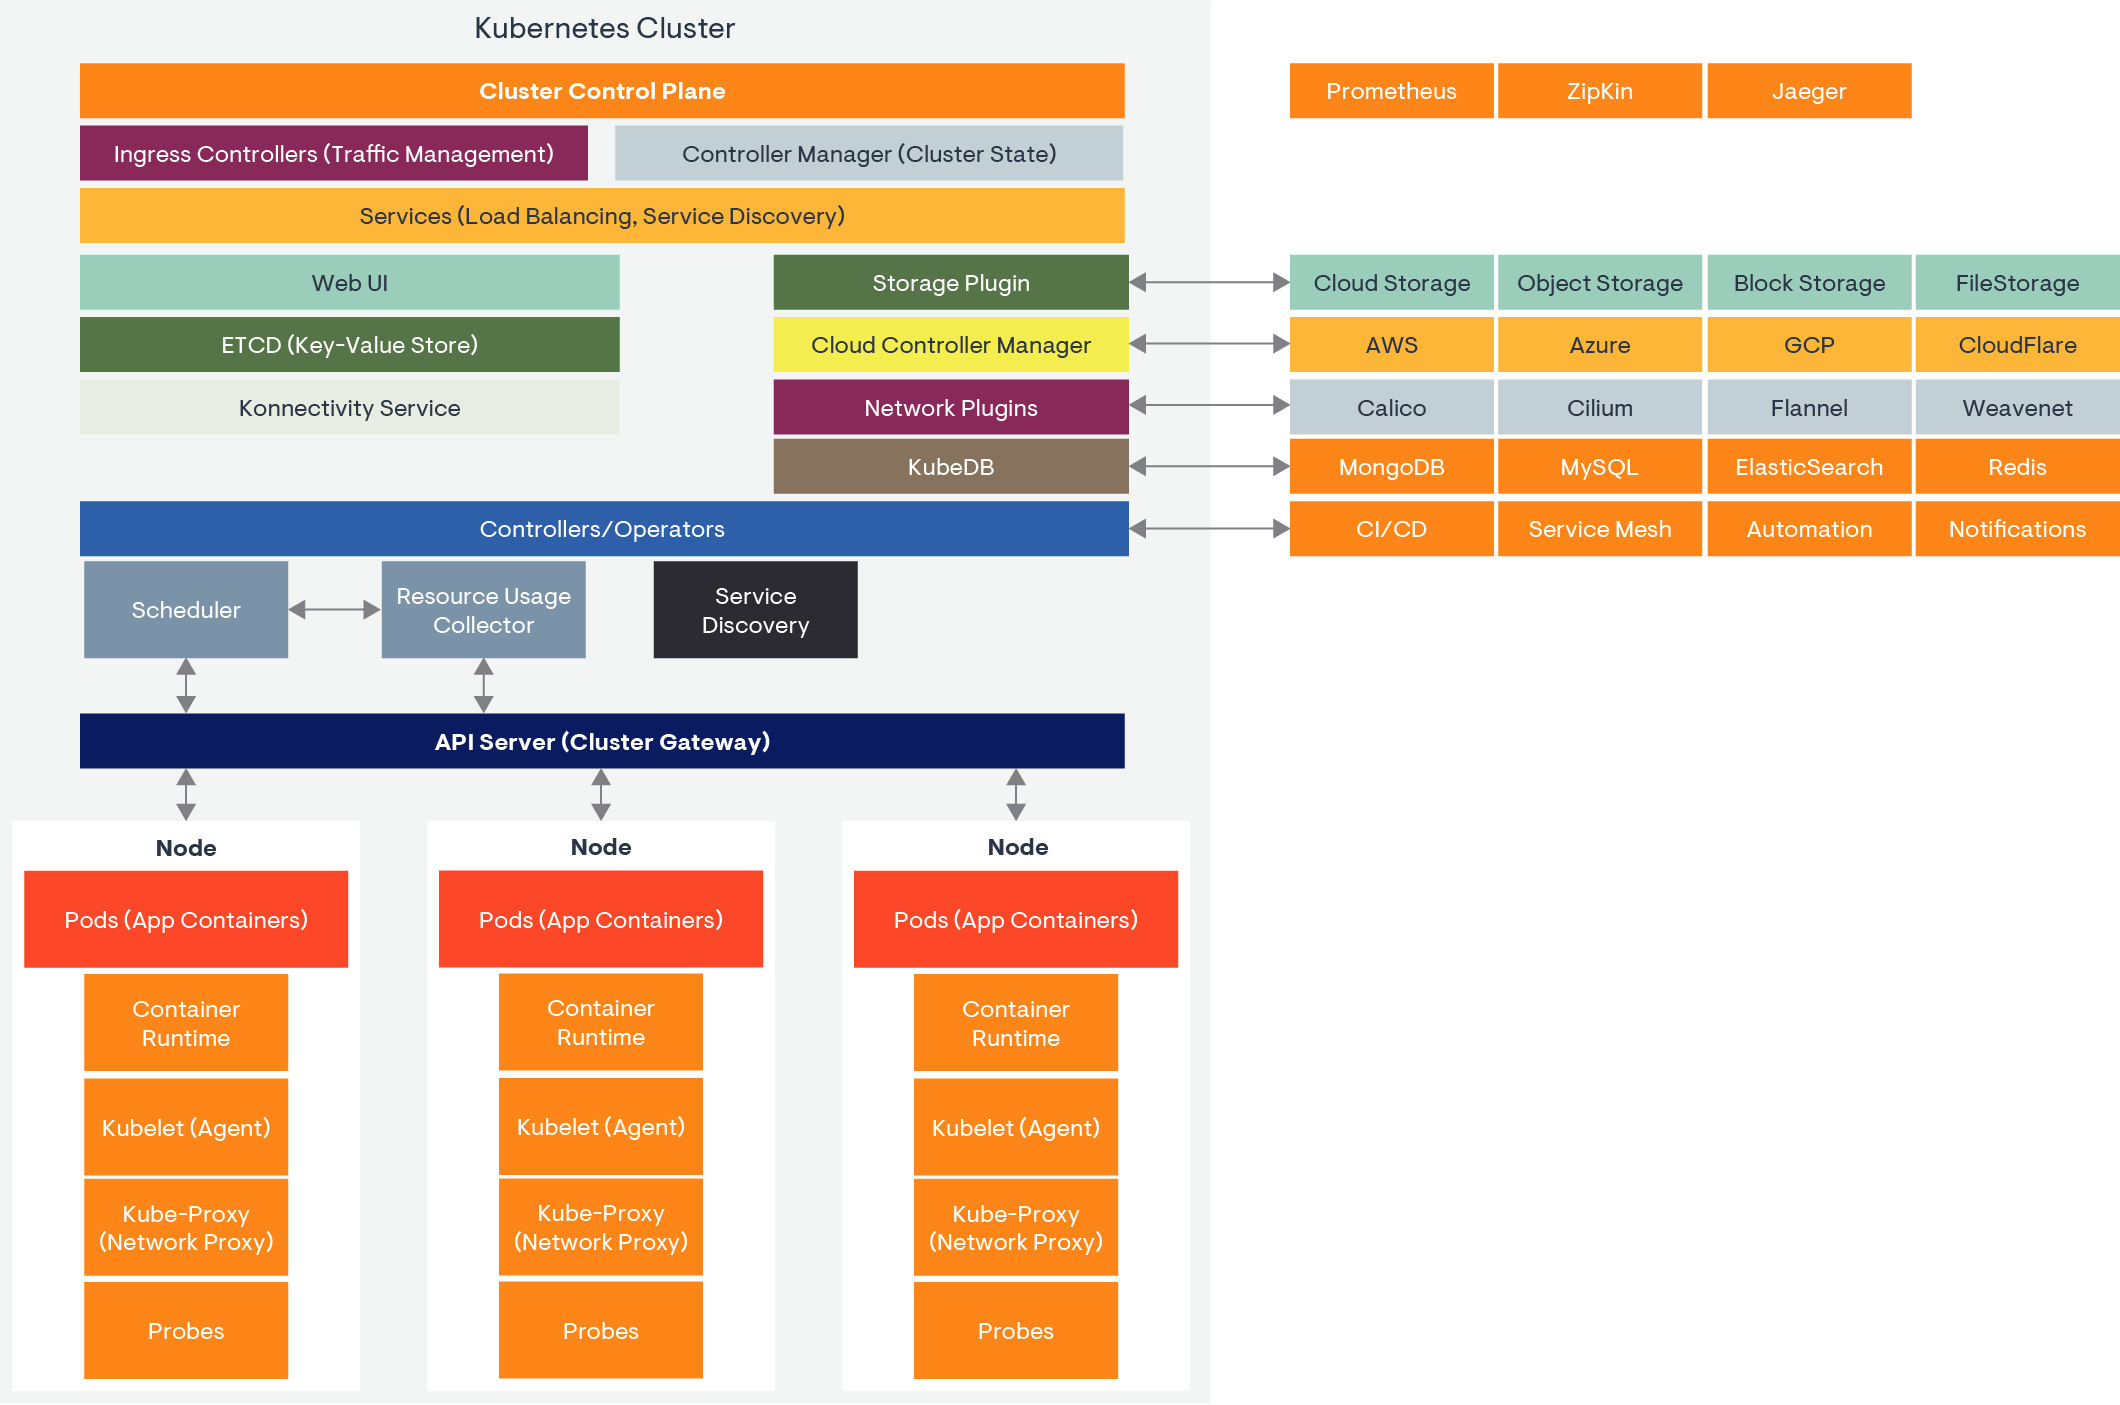
The OpenTelemetry Collector within a Kubernetes cluster can receive telemetry data from a variety of sources. Here’s a rundown of the 12 most relevant ones:
- Application instrumentation. Applications running in pods that are instrumented using OpenTelemetry SDKs can send traces, metrics, and logs to the Collector. Instrumentation can be manual or automatic (auto-instrumentation) depending on the language and framework.
- Node-level metrics. Node-level metrics can be collected via integrations with Kubernetes components like Kubelet, which exposes metrics about the node and the pods running on it.
- Kubernetes cluster events. Kubernetes cluster events can be collected, offering insights into what is happening within the cluster.
- Kubernetes API server. The API server provides control plane metrics and audit logs that can be collected by the OpenTelemetry Collector.
- Service mesh. If a service mesh like Istio or Linkerd is in use, the Collector can receive metrics and traces about the traffic between services.
- Container runtime. The container runtime (like Docker, containerd) on each node can provide metrics and logs about container states, resource usage, etc.
- Host metrics. System metrics from the host machine, such as CPU, memory, disk, and network usage.
- Logging daemons. Fluentd, Fluent Bit, or other logging daemons that collect logs from pods and nodes can be configured to send logs to the OpenTelemetry Collector.
- Third-party integrations. Various exporters or receivers for third-party systems like Prometheus, Jaeger, Zipkin, and others, which the Collector can receive data from.
- Cloud provider metrics. Metrics from cloud provider services, if the Kubernetes cluster is hosted on a cloud platform like AWS, GCP, or Azure.
- Probes and health checks. Liveness and readiness probes can generate data that, while not typically sent to the Collector directly, can influence application metrics collected.
- Custom metrics. Custom metrics sources, like those from in-cluster services or databases, that expose their own metrics in a format that the OpenTelemetry Collector can ingest.
The OpenTelemetry Collector is designed to be flexible and extensible, with the ability to receive data from these and other sources, process it, and export it to various backends for analysis and monitoring. It acts as a central component that unifies telemetry data collection across the cluster, making it an integral part of a comprehensive observability strategy.

The OpenTelemetry Protocol (OTLP)
The OpenTelemetry Protocol (OTLP) plays a crucial role in the OpenTelemetry ecosystem. It is responsible for the encoding, transport, and delivery of telemetry data between telemetry sources and intermediate nodes, such as Collectors, and telemetry backends. This protocol aims to specify a serialization schema that closely adheres to the data models of OpenTelemetry. OTLP supports both HTTP and gRPC as the underlying transport protocols. It primarily defines message structures, encoding, and endpoints. It can be used to export traces, metrics, and logs to a variety of backends. In summary, OTLP is a fundamental part of OpenTelemetry, enabling the efficient and standardized transmission of telemetry data across different components of the system.
OpenTelemetry spotlight: Instrumentation, data collection, and operation

Advantages of OpenTelemetry: A summary
OpenTelemetry stands as a pivotal framework in the observability landscape, offering a comprehensive suite of tools designed to enhance the monitoring and troubleshooting capabilities of modern applications. Its core strengths lie in its consistency, vendor neutrality, extensive language and platform support, partial auto-instrumentation capabilities, and its ability to provide a holistic view of application performance. Below, we delve into each of these aspects to understand why OpenTelemetry is increasingly becoming the go-to choice for organizations seeking robust observability solutions.
Consistency across environments
OpenTelemetry’s architecture ensures a consistent collection of logs, traces, and metrics across diverse application stacks. Whether deployed on-premises, in private or public clouds, or at edge locations, it offers a unified observability framework. This consistency is crucial for maintaining visibility and control over applications distributed across various environments, facilitating easier analysis and troubleshooting.
Vendor neutrality
A standout feature of OpenTelemetry is its vendor-neutral design. It supports data consumption by all major observability platform vendors, allowing organizations to switch between vendors without the need to reengineer their application instrumentation or telemetry data pipelines. This flexibility empowers customers to choose the best tools for their needs without being locked into a single vendor, fostering a competitive market that benefits end users.
Wide language and platform support
OpenTelemetry’s extensive support for various development frameworks, enterprise applications, databases, and infrastructure ensures that it can be integrated into nearly any system. This wide-ranging support is vital for organizations that use a mix of technologies and platforms because it simplifies the instrumentation process and ensures comprehensive observability across the entire technology stack.
Partial auto-instrumentation
The framework includes out-of-the-box instrumentation for many infrastructure components and application frameworks, which can significantly reduce the manual effort required to implement observability. While some initialization may be necessary, the partial auto-instrumentation feature streamlines the process, making it easier for organizations to get started with OpenTelemetry.
Holistic view of application performance
By collecting logs, metrics, and traces, OpenTelemetry provides unified telemetry data streams for individual components of the application stack. This holistic view is essential for understanding the performance and health of applications in a comprehensive manner, enabling more effective optimization and troubleshooting efforts.
Conclusion
OpenTelemetry’s unified approach, vendor neutrality, broad language and platform support, partial auto-instrumentation capabilities, and comprehensive observability make it an attractive option for many organizations. However, the decision to adopt OpenTelemetry should be based on specific requirements, existing tools, and preferences. Evaluating OpenTelemetry in the context of an organization’s unique needs is crucial to leveraging its full potential.
