Plugins 〉3CX


3CX
3CX App Plugin for Grafana
The 3CX App for Grafana brings clarity and visibility to your 3CX system.
It offers rich reporting and dashboard features directly within the 3CX IP PBX software.
Get started in minutes — no coding, no complexity.
Key Features
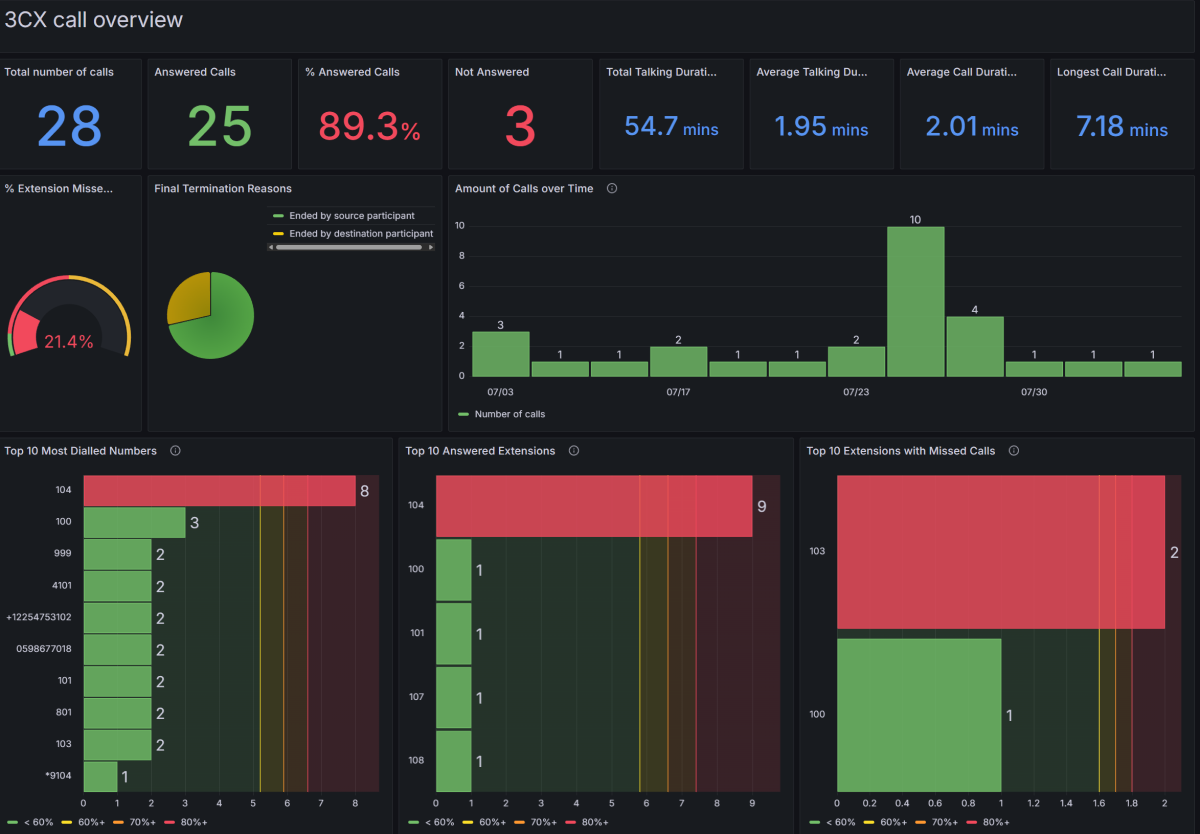
Out-of-the-Box Dashboards
Get instant insights with pre-built panels for key metrics:
- Call volumes
- Agent activity
- Inbound vs. outbound traffic
- Call statuses and durations
- Quality and engagement analytics
Multiple Database Support
Connect quickly, whether you’re on the cloud or on-prem. Supported data sources include:
- Google BigQuery
- PostgreSQL
- MySQL
- Microsoft SQL Server
Built for 3CX
All dashboards are designed specifically for 3CX environments, ensuring compatibility and meaningful KPIs right from the start.
Who Is This For?
- IT Admins looking for visibility into call infrastructure
- Support and Operations teams seeking actionable insights
- Managed Service Providers (MSPs) offering 3CX support at scale
Before you begin
Make sure the Data Connector is configured in your PBX. For step-by-step instructions, see the configuration guides:
- Connecting 3CX to Google BigQuery & Grafana
- Connecting 3CX to AWS RDS PostgreSQL & Grafana
- Connecting 3CX to MySQL & Grafana
- Connecting 3CX to Microsoft SQL Server & Grafana
Getting Started
- Install and Enable Plugin from the Grafana Marketplace
- Follow instructions in the Plugin's Configuration Page
Grafana Cloud Free
- Free tier: Limited to 3 users
- Paid plans: $55 / user / month above included usage
- Access to all Enterprise Plugins
- Fully managed service (not available to self-manage)
Self-hosted Grafana Enterprise
- Access to all Enterprise plugins
- All Grafana Enterprise features
- Self-manage on your own infrastructure
Installing 3CX on Grafana Cloud:
Installing plugins on a Grafana Cloud instance is a one-click install; same with updates. Cool, right?
Note that it could take up to 1 minute to see the plugin show up in your Grafana.
Warning
Plugin installation from this page will be removed in February 2026. Use the Plugin Catalog in your Grafana instance instead. Refer to Install a plugin in the Grafana documentation for more information.
Installing plugins on a Grafana Cloud instance is a one-click install; same with updates. Cool, right?
Note that it could take up to 1 minute to see the plugin show up in your Grafana.
Installing plugins on a Grafana Cloud instance is a one-click install; same with updates. Cool, right?
Note that it could take up to 1 minute to see the plugin show up in your Grafana.
Warning
Plugin installation from this page will be removed in February 2026. Use the Plugin Catalog in your Grafana instance instead. Refer to Install a plugin in the Grafana documentation for more information.
Installing plugins on a Grafana Cloud instance is a one-click install; same with updates. Cool, right?
Note that it could take up to 1 minute to see the plugin show up in your Grafana.
For more information, visit the docs on plugin installation.
Installing on a local Grafana:
For local instances, plugins are installed and updated via a simple CLI command. Plugins are not updated automatically, however you will be notified when updates are available right within your Grafana.
1. Install the Application
Use the grafana-cli tool to install 3CX from the commandline:
grafana-cli plugins install The plugin will be installed into your grafana plugins directory; the default is /var/lib/grafana/plugins. More information on the cli tool.
Alternatively, you can manually download the .zip file for your architecture below and unpack it into your grafana plugins directory.
Alternatively, you can manually download the .zip file and unpack it into your grafana plugins directory.
2. Enable it
Next, log into your Grafana instance. Navigate to the Plugins section, found in your Grafana main menu.
Click the Apps tabs in the Plugins section and select the newly installed app.
To enable the app, click the Config tab. Follow the instructions provided with the application and click Enable. The app and any new UI pages are now accessible from within the main menu, as designed by the app creator.
If dashboards have been included with the application, they will attempt to be automatically installed. To view the dashboards, re-import or delete individual dashboards, click the Dashboards tab within the app page.
Changelog
1.0.0
Initial release.
1.0.1
Minor plugin overview fixes.
1.0.2
More detailed and soft publishing process.
1.0.3
Improved main page layout.
1.0.4
- Updated dashboards.
- Synchronized the Grafana version in plugin and dashboards.
1.0.5
- Improving Queues dashboard.