
Plugins 〉Word cloud


Word cloud


☁️ WordCloud Panel Plugin
⚠️ Unmaintained and looking for a new owner ⚠️
I no longer have the time to maintain this plugin and would love for someone to take it over and continue development.
If you are interested, please comment in this issue 🙏
This is a Wordcloud/Tagcloud panel for Grafana 7.0+, using the amazing library react-wordcloud
This was boostraped using the new @grafana/toolkit
Features
You can find features and personalization options here
Usage
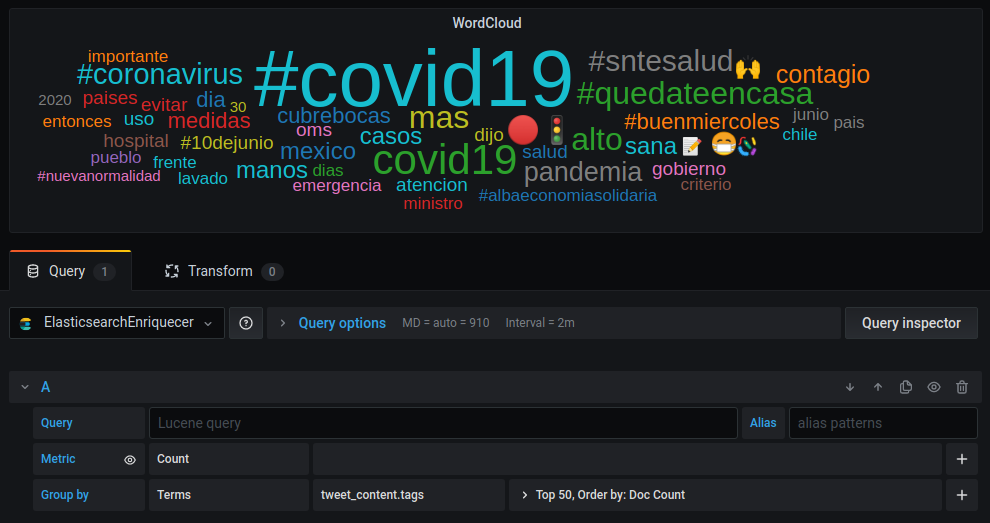
You need to configure a datasource so that the query returns a list of tokens and group the result by terms. You should change the names of word, and count fields in the options tab of the plugin according to your query, if you don't default fields with matching types present in your query will be used. The amount of words is configured in the datasource settings. In those settings is also important that you choose "Order by: Doc Count".
Every other settings for the wordcloud can be changed in the plugin options tab.
ToDo
It would be really nice to use the library's available callbacks to filter grafana dashboard data when a word is clicked. I haven't found a neat way to do this yet. Issue #5
Grafana Cloud Free
- Free tier: Limited to 3 users
- Paid plans: $55 / user / month above included usage
- Access to all Enterprise Plugins
- Fully managed service (not available to self-manage)
Self-hosted Grafana Enterprise
- Access to all Enterprise plugins
- All Grafana Enterprise features
- Self-manage on your own infrastructure
Installing Word cloud on Grafana Cloud:
Installing plugins on a Grafana Cloud instance is a one-click install; same with updates. Cool, right?
Note that it could take up to 1 minute to see the plugin show up in your Grafana.
Warning
Plugin installation from this page will be removed in February 2026. Use the Plugin Catalog in your Grafana instance instead. Refer to Install a plugin in the Grafana documentation for more information.
Installing plugins on a Grafana Cloud instance is a one-click install; same with updates. Cool, right?
Note that it could take up to 1 minute to see the plugin show up in your Grafana.
Installing plugins on a Grafana Cloud instance is a one-click install; same with updates. Cool, right?
Note that it could take up to 1 minute to see the plugin show up in your Grafana.
Warning
Plugin installation from this page will be removed in February 2026. Use the Plugin Catalog in your Grafana instance instead. Refer to Install a plugin in the Grafana documentation for more information.
Installing plugins on a Grafana Cloud instance is a one-click install; same with updates. Cool, right?
Note that it could take up to 1 minute to see the plugin show up in your Grafana.
For more information, visit the docs on plugin installation.
Installing on a local Grafana:
For local instances, plugins are installed and updated via a simple CLI command. Plugins are not updated automatically, however you will be notified when updates are available right within your Grafana.
1. Install the Panel
Use the grafana-cli tool to install Word cloud from the commandline:
grafana-cli plugins install The plugin will be installed into your grafana plugins directory; the default is /var/lib/grafana/plugins. More information on the cli tool.
Alternatively, you can manually download the .zip file for your architecture below and unpack it into your grafana plugins directory.
Alternatively, you can manually download the .zip file and unpack it into your grafana plugins directory.
2. Add the Panel to a Dashboard
Installed panels are available immediately in the Dashboards section in your Grafana main menu, and can be added like any other core panel in Grafana.
To see a list of installed panels, click the Plugins item in the main menu. Both core panels and installed panels will appear.
Change Log
All notable changes to this project will be documented in this file.
v1.2.3
Stopwords and automatic release with github actions
v1.0.0
Initial Release