
Plugins 〉Highlight.io


Highlight.io


The highlight.io data source for Grafana
The highlight.io data source plugin allows you to query, visualize, and alert on metrics derived from highlight.io traces, logs, errors, and sessions.
Requirements
There are no requirements or dependencies to test the highlight.io data source in our demo environment.
To use this data source for your cloud-managed project, you must be an enterprise customer. If you're interested in getting this set up, please reach out to us at support@highlight.io.
If you're already self-hosting highlight.io with a hobby or enterprise deployment, you're good to go. If you'd like to set up your own self-hosted instance, you can follow the getting started guide.
Getting Started with the highlight.io data source
Configuration
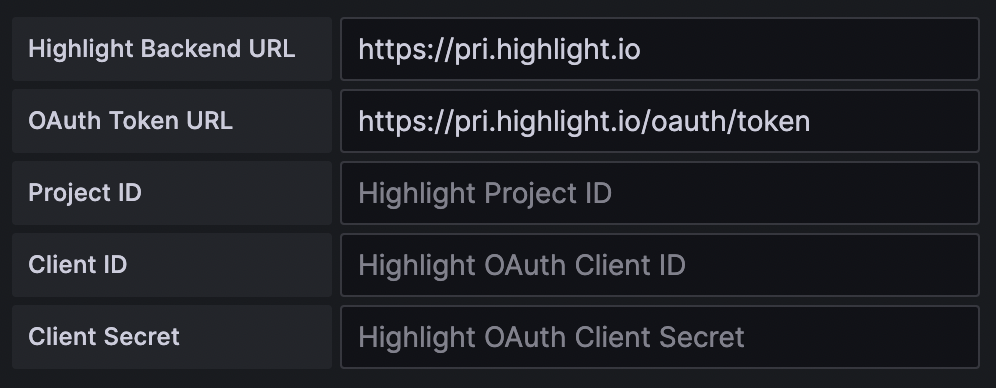
Once you have added a highlight.io data source, you can configure it with these fields:
| Name | Description |
|---|---|
Highlight Backend URL | The URL used to query highlight.io data. If you are using cloud-managed highlight.io, set this to https://pri.highlight.io. |
OAuth Token URL | The URL used to retrieve an OAuth access token. If you are using cloud-managed highlight.io, set this to https://pri.highlight.io/oauth/token. |
Project ID | The highlight.io project ID, accessible from the URL slug of your highlight.io project, e.g. https://app.highlight.io/{project_id}/. If you want to query data from multiple projects, you can set up multiple data sources. To query the demo project, set this to 1344. |
Client ID | If you are using cloud-managed highlight.io, set this to your OAuth client ID. If you are setting up the data source for the first time and need a client ID, reach out to us at support@highlight.io. If you are self-hosting highlight.io or using the demo project, leave this blank. |
Client Secret | If you are using cloud-managed highlight.io, set this to your OAuth client secret. If you are setting up the data source for the first time and need a client secret, reach out to us at support@highlight.io. If you are self-hosting highlight.io or using the demo project, leave this blank. |
After entering these fields, clicking Save & test will run a health check to verify that the data source is able to query highlight.io data.
Building your first query
The highlight.io data source query editor lets you interactively build a query to search and visualize your metrics from highlight.io traces, logs, errors, and sessions. To get started, add a new dashboard visualization or alert rule with the highlight.io data source.
The query editor is configurable with these fields:
| Name | Description |
|---|---|
Resource | The highlight.io resource being queried for these metrics. |
Function | The method used for aggregating data within a group and bucket, e.g. count, avg, p50. If the function operates on a metric, numeric fields from the linked project's data are shown as search suggestions. |
Filter | A highlight.io filtering expression can be used to include only matching resources. Follows the search syntax shown here. |
Group by | One or more categories to group the results by. Categorical fields from the linked project's data are shown as search suggestions. |
Limit N | If one or more "group by" categories are selected, the result groups are limited to the top N. |
Limit by function | If one or more "group by" categories are selected, this method is used to rank categories before returning the top N. |
Bucket by | The dimension used for bucketing numeric data. Supports bucketing by timestamp, no bucketing, or a custom bucketing key for histogram visualizations. |
Buckets | The number of buckets returned. |
Documentation
The docs page for the highlight.io Grafana plugin is available here.
If you have any further questions about highlight.io, you can visit our docs or reach out to us at support@highlight.io.
Contributing
Looking to contribute to highlight.io? Get started here.
Grafana Cloud Free
- Free tier: Limited to 3 users
- Paid plans: $55 / user / month above included usage
- Access to all Enterprise Plugins
- Fully managed service (not available to self-manage)
Self-hosted Grafana Enterprise
- Access to all Enterprise plugins
- All Grafana Enterprise features
- Self-manage on your own infrastructure
Installing Highlight.io on Grafana Cloud:
Installing plugins on a Grafana Cloud instance is a one-click install; same with updates. Cool, right?
Note that it could take up to 1 minute to see the plugin show up in your Grafana.
Warning
Plugin installation from this page will be removed in February 2026. Use the Plugin Catalog in your Grafana instance instead. Refer to Install a plugin in the Grafana documentation for more information.
Installing plugins on a Grafana Cloud instance is a one-click install; same with updates. Cool, right?
Note that it could take up to 1 minute to see the plugin show up in your Grafana.
Installing plugins on a Grafana Cloud instance is a one-click install; same with updates. Cool, right?
Note that it could take up to 1 minute to see the plugin show up in your Grafana.
Warning
Plugin installation from this page will be removed in February 2026. Use the Plugin Catalog in your Grafana instance instead. Refer to Install a plugin in the Grafana documentation for more information.
Installing plugins on a Grafana Cloud instance is a one-click install; same with updates. Cool, right?
Note that it could take up to 1 minute to see the plugin show up in your Grafana.
For more information, visit the docs on plugin installation.
Installing on a local Grafana:
For local instances, plugins are installed and updated via a simple CLI command. Plugins are not updated automatically, however you will be notified when updates are available right within your Grafana.
1. Install the Data Source
Use the grafana-cli tool to install Highlight.io from the commandline:
grafana-cli plugins install The plugin will be installed into your grafana plugins directory; the default is /var/lib/grafana/plugins. More information on the cli tool.
Alternatively, you can manually download the .zip file for your architecture below and unpack it into your grafana plugins directory.
Alternatively, you can manually download the .zip file and unpack it into your grafana plugins directory.
2. Configure the Data Source
Accessed from the Grafana main menu, newly installed data sources can be added immediately within the Data Sources section.
Next, click the Add data source button in the upper right. The data source will be available for selection in the Type select box.
To see a list of installed data sources, click the Plugins item in the main menu. Both core data sources and installed data sources will appear.
Changelog
0.2.1
Patch Changes
- 30a0e0a22: update dependencies
1.0.0 (Unreleased)
Initial release.