
Plugins 〉OData


OData


Grafana OData Data Source
Visualize data from OData data sources with Grafana.
About
This is a Grafana data source for showing data from OData V4 compliant data sources.
It was originally developed for internal purposes and is now made available to the open source community.
Getting started
Open Grafana and go to Configuration / Data Sources. Click Add data source button.
Enter OData into the filter input field and select the OData Data Source.
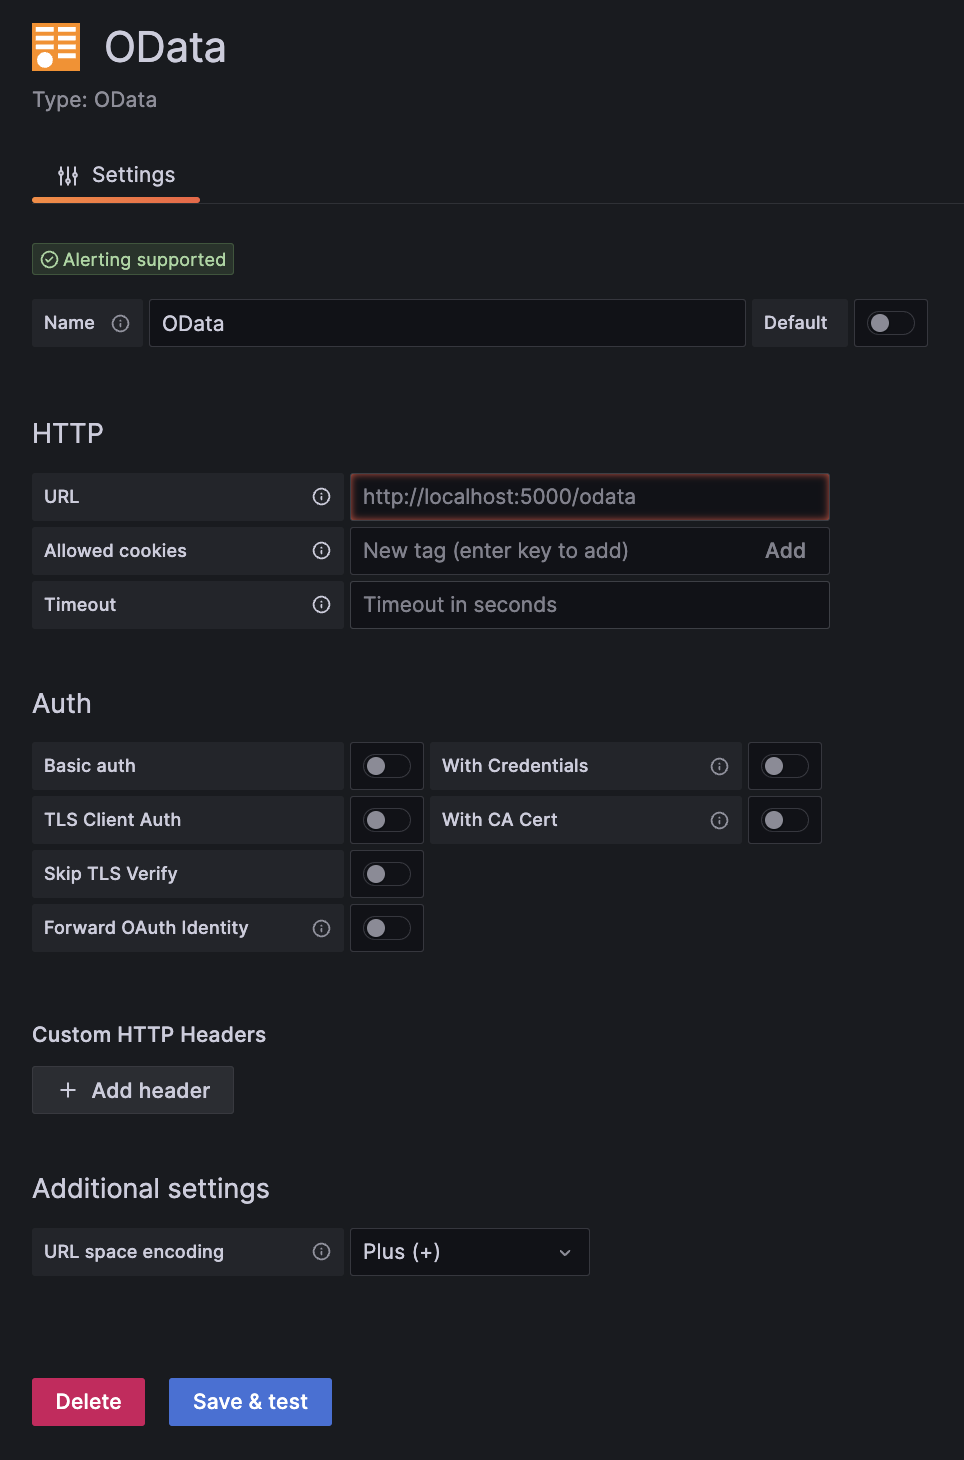
Provide the URL of your OData Service Root and click Save & test to test the connection.
The URL space encoding setting can be used to specify the encoding of spaces in URLs. Percent uses %20 (see RFC
3986), while Plus uses + (used in form data). E.g. $filter=value%20EQ%201 vs. $filter=value+EQ+1.
Add other connection settings, such as auth settings, as necessary.
To use the data source, create a new query and select the newly created OData data source.
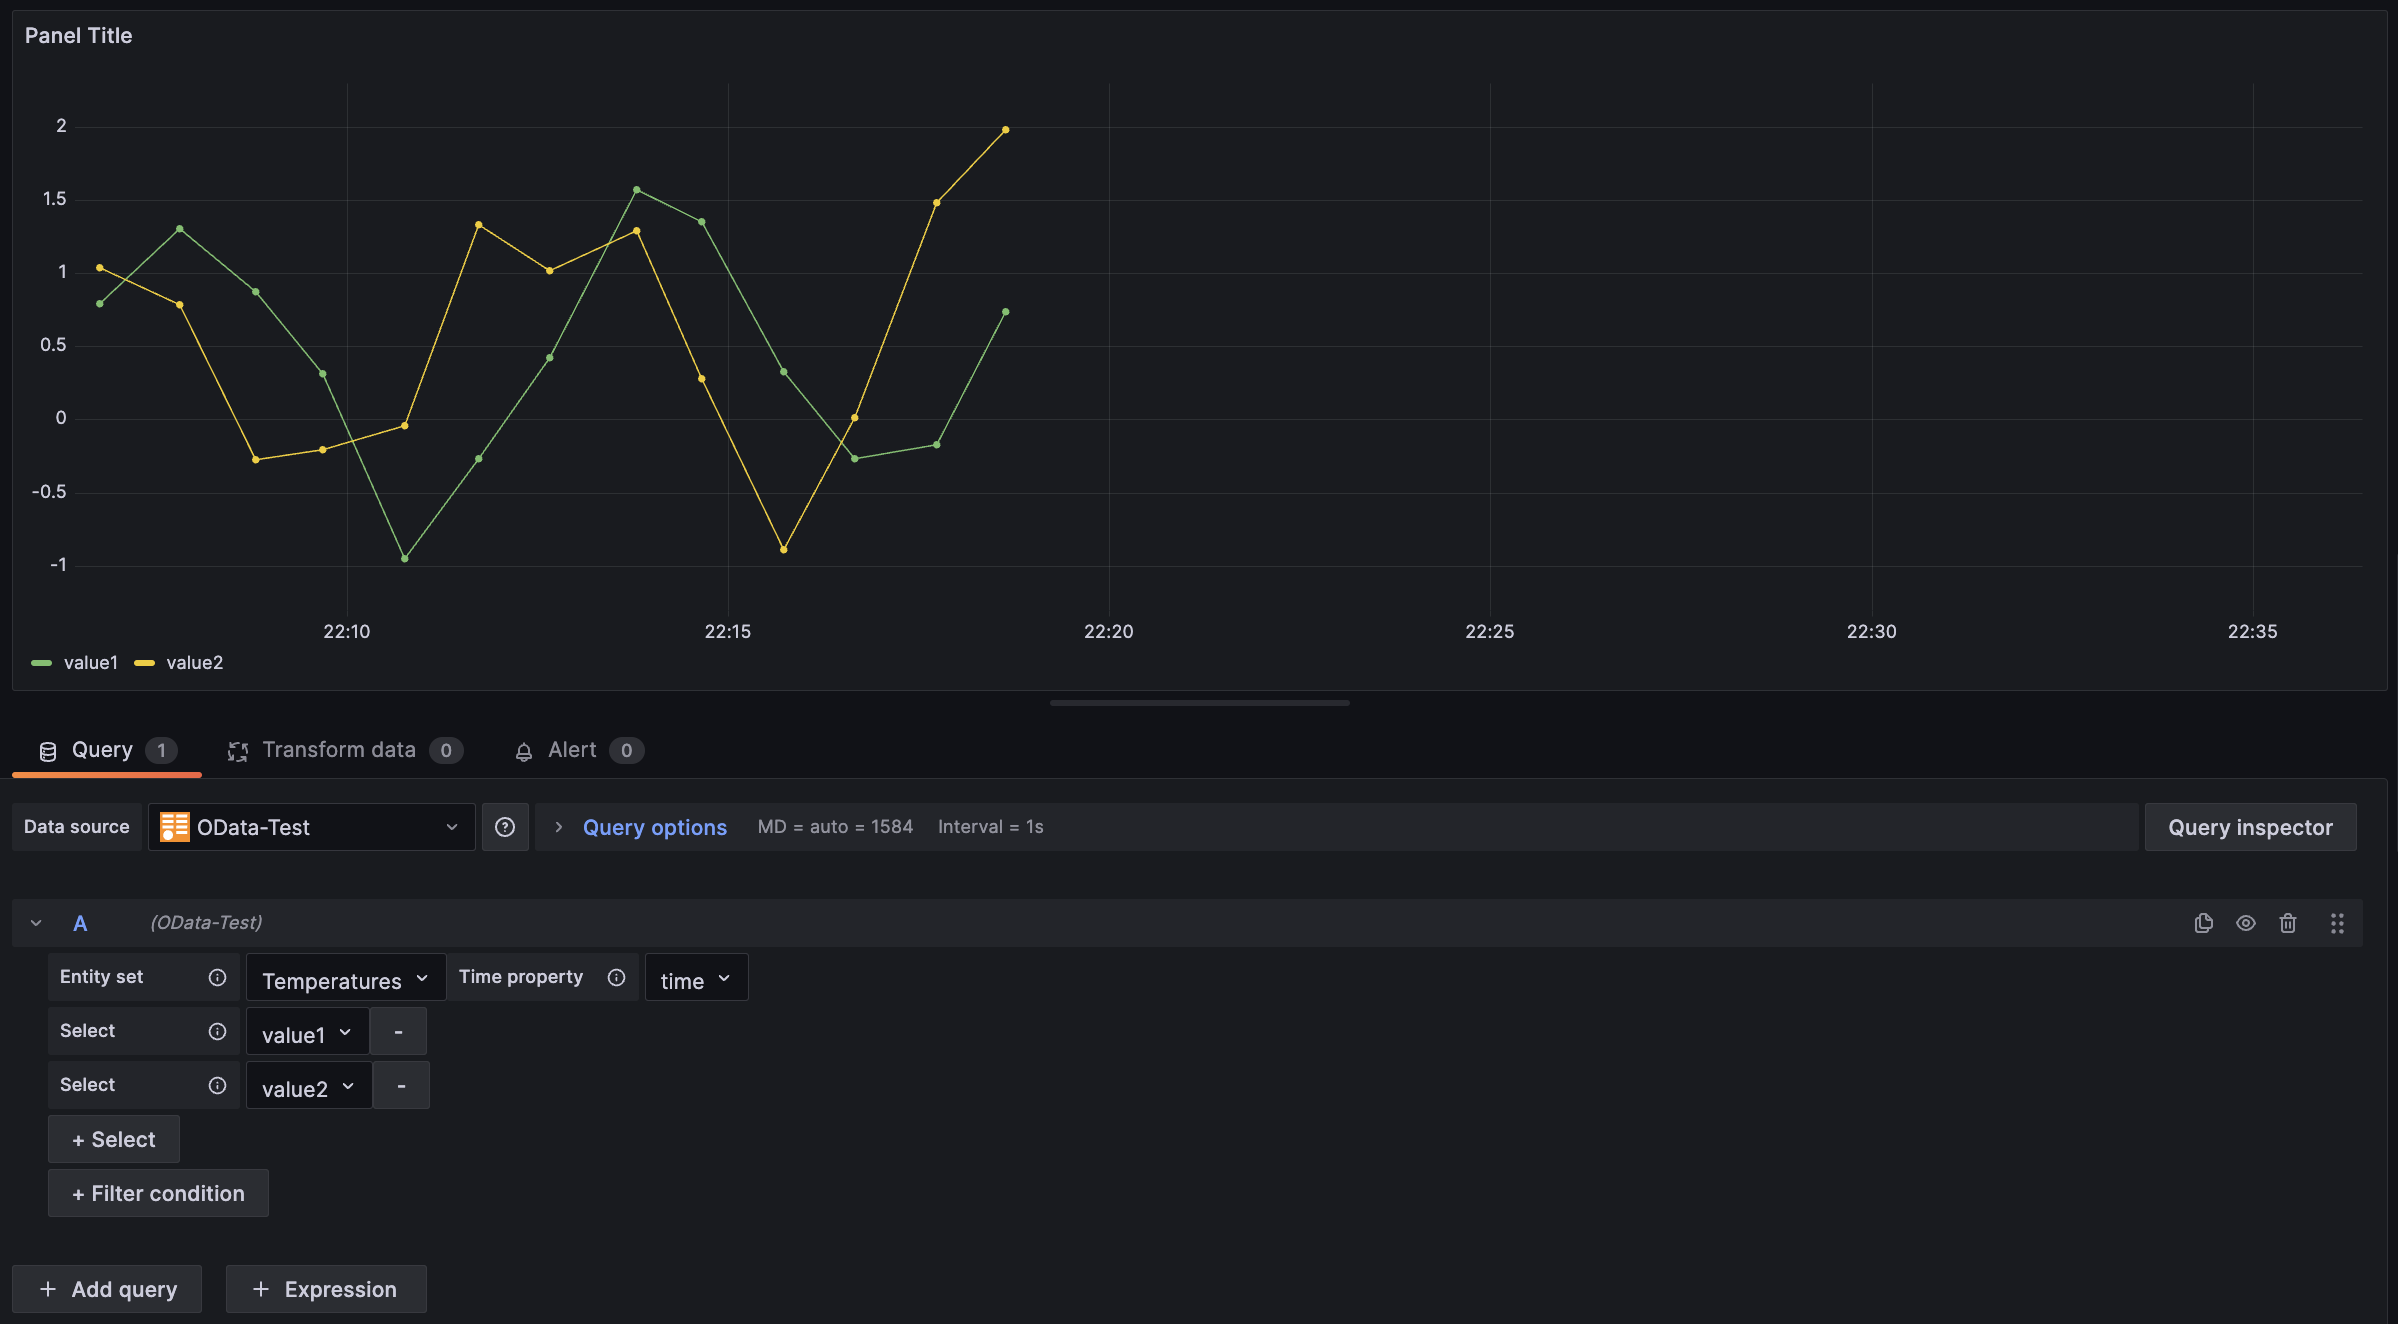
Choose an entity set, an appropriate time property, and the metric you want to view. Now you should be able to see data for the selected time frame.
Related Links
- Grafana - the open source analytics & monitoring solution for many data sources
- Build a Grafana data source plugin - a tutorial that explains how to develop your own data source plugin.
- OData - the ISO/IEC approved, OASIS standard for building and using data-driven RESTful APIs
Contributing
This project is maintained by d-velop but is looking for contributors. If you consider contributing to this project please read CONTRIBUTING and DEVELOPING for details on how to get started.
License
Please read LICENSE for licensing information.
Grafana Cloud Free
- Free tier: Limited to 3 users
- Paid plans: $55 / user / month above included usage
- Access to all Enterprise Plugins
- Fully managed service (not available to self-manage)
Self-hosted Grafana Enterprise
- Access to all Enterprise plugins
- All Grafana Enterprise features
- Self-manage on your own infrastructure
Installing OData on Grafana Cloud:
Installing plugins on a Grafana Cloud instance is a one-click install; same with updates. Cool, right?
Note that it could take up to 1 minute to see the plugin show up in your Grafana.
Warning
Plugin installation from this page will be removed in February 2026. Use the Plugin Catalog in your Grafana instance instead. Refer to Install a plugin in the Grafana documentation for more information.
Installing plugins on a Grafana Cloud instance is a one-click install; same with updates. Cool, right?
Note that it could take up to 1 minute to see the plugin show up in your Grafana.
Installing plugins on a Grafana Cloud instance is a one-click install; same with updates. Cool, right?
Note that it could take up to 1 minute to see the plugin show up in your Grafana.
Warning
Plugin installation from this page will be removed in February 2026. Use the Plugin Catalog in your Grafana instance instead. Refer to Install a plugin in the Grafana documentation for more information.
Installing plugins on a Grafana Cloud instance is a one-click install; same with updates. Cool, right?
Note that it could take up to 1 minute to see the plugin show up in your Grafana.
For more information, visit the docs on plugin installation.
Installing on a local Grafana:
For local instances, plugins are installed and updated via a simple CLI command. Plugins are not updated automatically, however you will be notified when updates are available right within your Grafana.
1. Install the Data Source
Use the grafana-cli tool to install OData from the commandline:
grafana-cli plugins install The plugin will be installed into your grafana plugins directory; the default is /var/lib/grafana/plugins. More information on the cli tool.
Alternatively, you can manually download the .zip file for your architecture below and unpack it into your grafana plugins directory.
Alternatively, you can manually download the .zip file and unpack it into your grafana plugins directory.
2. Configure the Data Source
Accessed from the Grafana main menu, newly installed data sources can be added immediately within the Data Sources section.
Next, click the Add data source button in the upper right. The data source will be available for selection in the Type select box.
To see a list of installed data sources, click the Plugins item in the main menu. Both core data sources and installed data sources will appear.
Change Log
[1.1.1] 2025-04-17
Features
- Updated to go version
1.24 - Updated to Grafana
11.6
[1.1.0] 2024-03-14
Features
- #2: Made time property optional
- Updated to go version
1.21 - Updated to Grafana
10.2 - Configurable space encoding (
%20or+)
[1.0.0] 2023-05-12
Features
- Initial revision