
Plugins 〉Plotly panel


Plotly panel


Plotly Panel
https://github.com/ae3e/ae3e-plotly-panel
Render any kind of charts from any datasource with Plotly (An open source javascript graphing library)
Unlike the natel-plotly-panel, this plugin is not limited to specific types of charts. But, on the other hand, the user interface is really rough in order to let users to set all options available in Plotly.
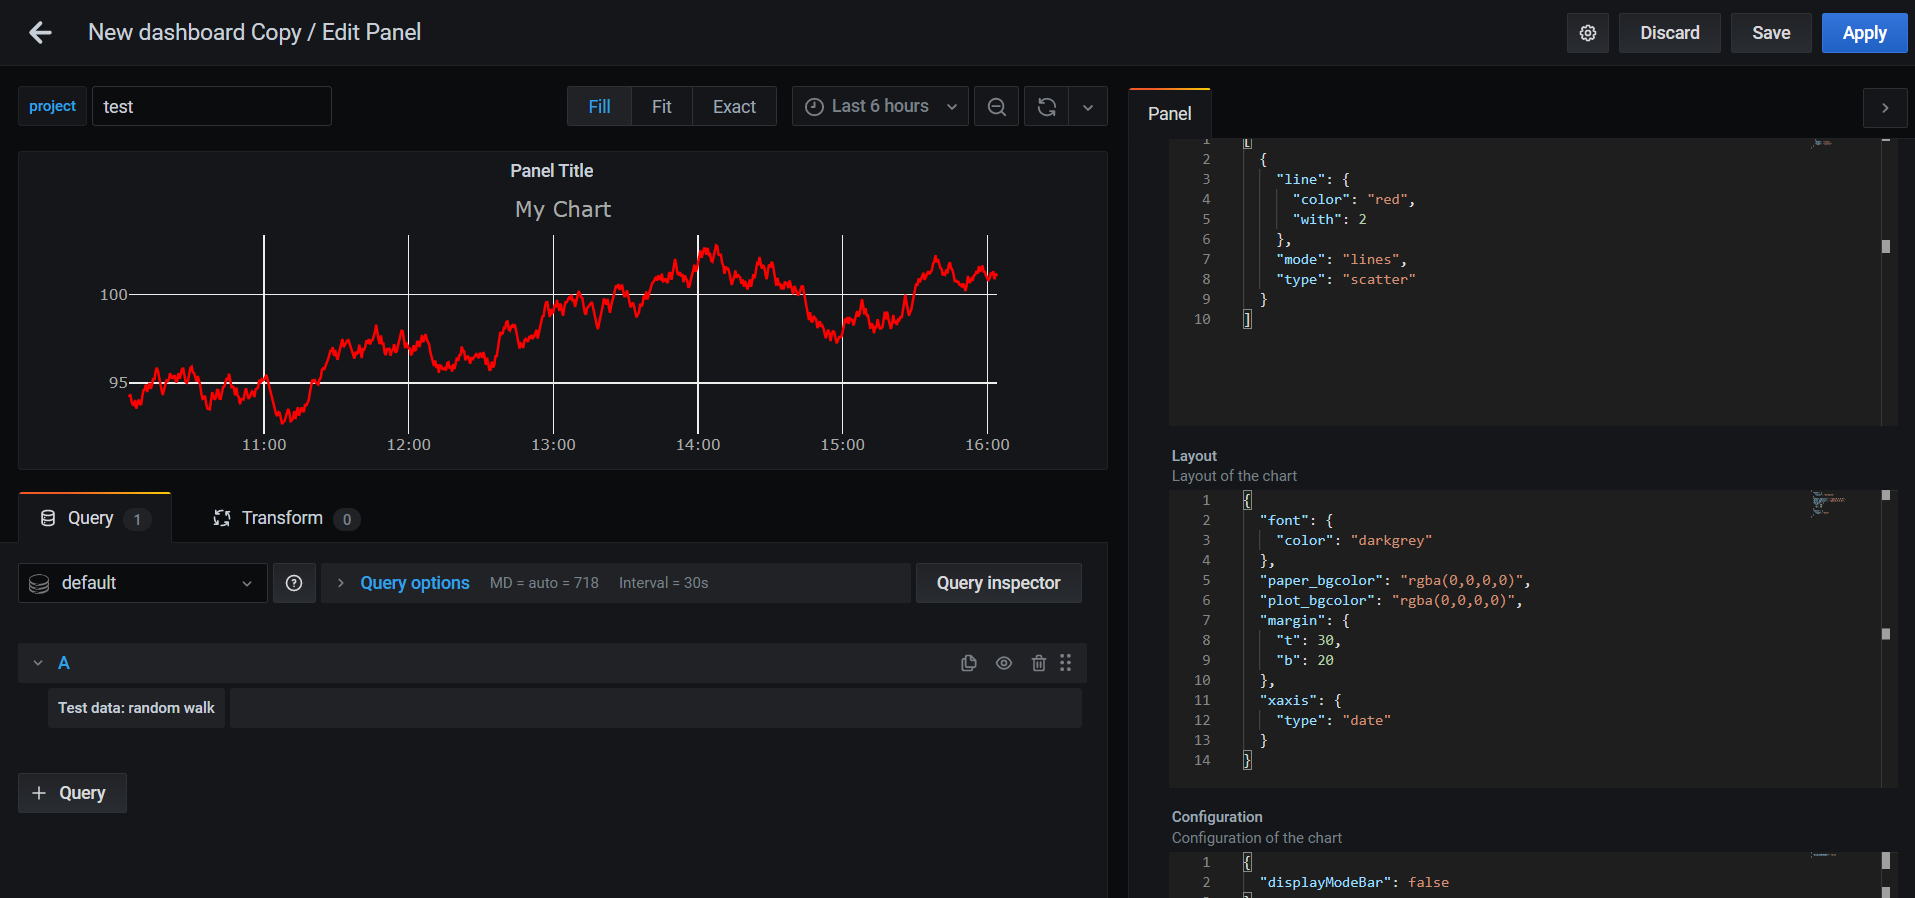
The Data, Layout and Config fields match the common parameters described in Plotly's documentation. They must be in JSON format.
Data provided by the datasource can be transformed via a user-defined script before to be injected in the Plotly chart. The script includes 2 arguments :
data: Data returns by the datasourcevariables: Object that contains Grafana's variables available in the current dashboard (user variables and few global variables :__from,__to,__intervaland__interval_ms).
The script must return an object with one or more of the following properties : data, layout, config and frames.
example :
let x  = data.series[0].fields[0].values.buffer
let y  = data.series[0].fields[1].values.buffer
let serie = {
x : x,
y : y,
name : variables.project //where project is the name of a Grafana’s variable
}
return {
data : [serie],
config : {
displayModeBar: false
}
}
Object returned by the script and JSON provided in the Data, Layout and Config fields will be merged (deep merge).
If no script is provided, the panel will use only Data, Layout and Config fields.
Plotly panel editor :
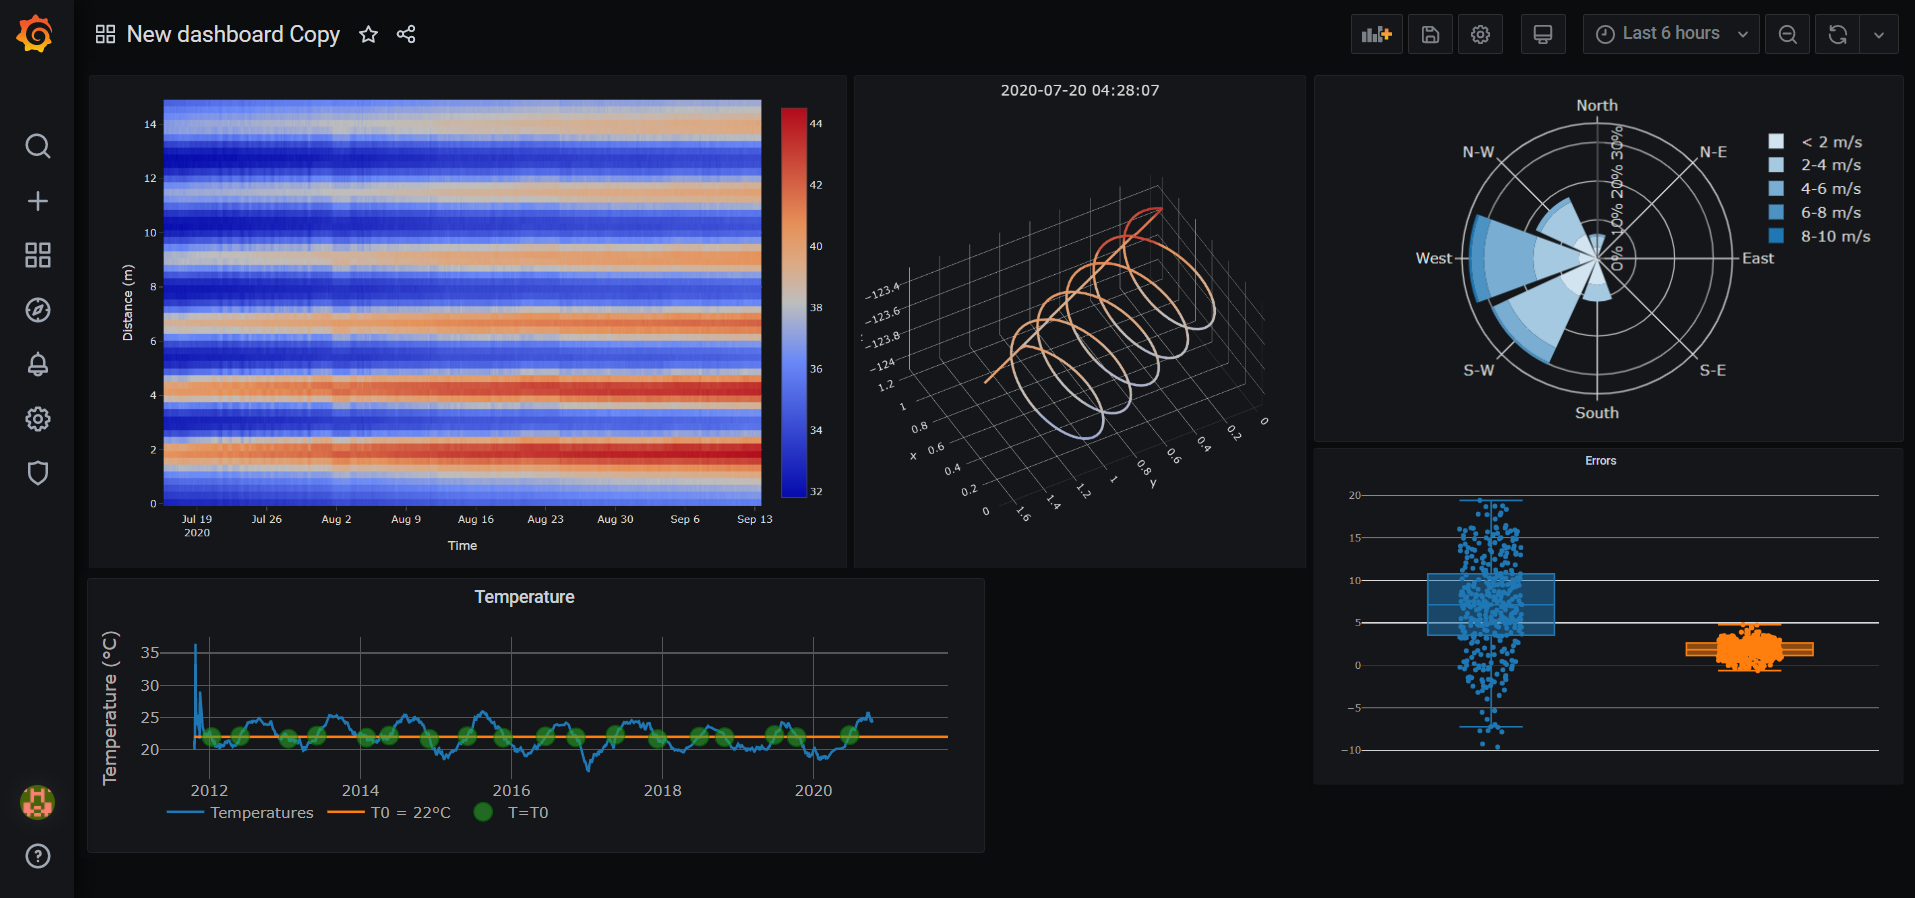
Example of charts :
Grafana Cloud Free
- Free tier: Limited to 3 users
- Paid plans: $55 / user / month above included usage
- Access to all Enterprise Plugins
- Fully managed service (not available to self-manage)
Self-hosted Grafana Enterprise
- Access to all Enterprise plugins
- All Grafana Enterprise features
- Self-manage on your own infrastructure
Installing Plotly panel on Grafana Cloud:
Installing plugins on a Grafana Cloud instance is a one-click install; same with updates. Cool, right?
Note that it could take up to 1 minute to see the plugin show up in your Grafana.
Warning
Plugin installation from this page will be removed in February 2026. Use the Plugin Catalog in your Grafana instance instead. Refer to Install a plugin in the Grafana documentation for more information.
Installing plugins on a Grafana Cloud instance is a one-click install; same with updates. Cool, right?
Note that it could take up to 1 minute to see the plugin show up in your Grafana.
Installing plugins on a Grafana Cloud instance is a one-click install; same with updates. Cool, right?
Note that it could take up to 1 minute to see the plugin show up in your Grafana.
Warning
Plugin installation from this page will be removed in February 2026. Use the Plugin Catalog in your Grafana instance instead. Refer to Install a plugin in the Grafana documentation for more information.
Installing plugins on a Grafana Cloud instance is a one-click install; same with updates. Cool, right?
Note that it could take up to 1 minute to see the plugin show up in your Grafana.
For more information, visit the docs on plugin installation.
Installing on a local Grafana:
For local instances, plugins are installed and updated via a simple CLI command. Plugins are not updated automatically, however you will be notified when updates are available right within your Grafana.
1. Install the Panel
Use the grafana-cli tool to install Plotly panel from the commandline:
grafana-cli plugins install The plugin will be installed into your grafana plugins directory; the default is /var/lib/grafana/plugins. More information on the cli tool.
Alternatively, you can manually download the .zip file for your architecture below and unpack it into your grafana plugins directory.
Alternatively, you can manually download the .zip file and unpack it into your grafana plugins directory.
2. Add the Panel to a Dashboard
Installed panels are available immediately in the Dashboards section in your Grafana main menu, and can be added like any other core panel in Grafana.
To see a list of installed panels, click the Plugins item in the main menu. Both core panels and installed panels will appear.