
Server Status
PROMETHEUS DASHBOARD Include : http 200; 300; 400; 500 cpu usage and overall cpu utilization filter (clik + ctrl for multiple select) load average disk write/read network in/out host choice interval choice flat color ! and some informations in the top left corner of certain graph
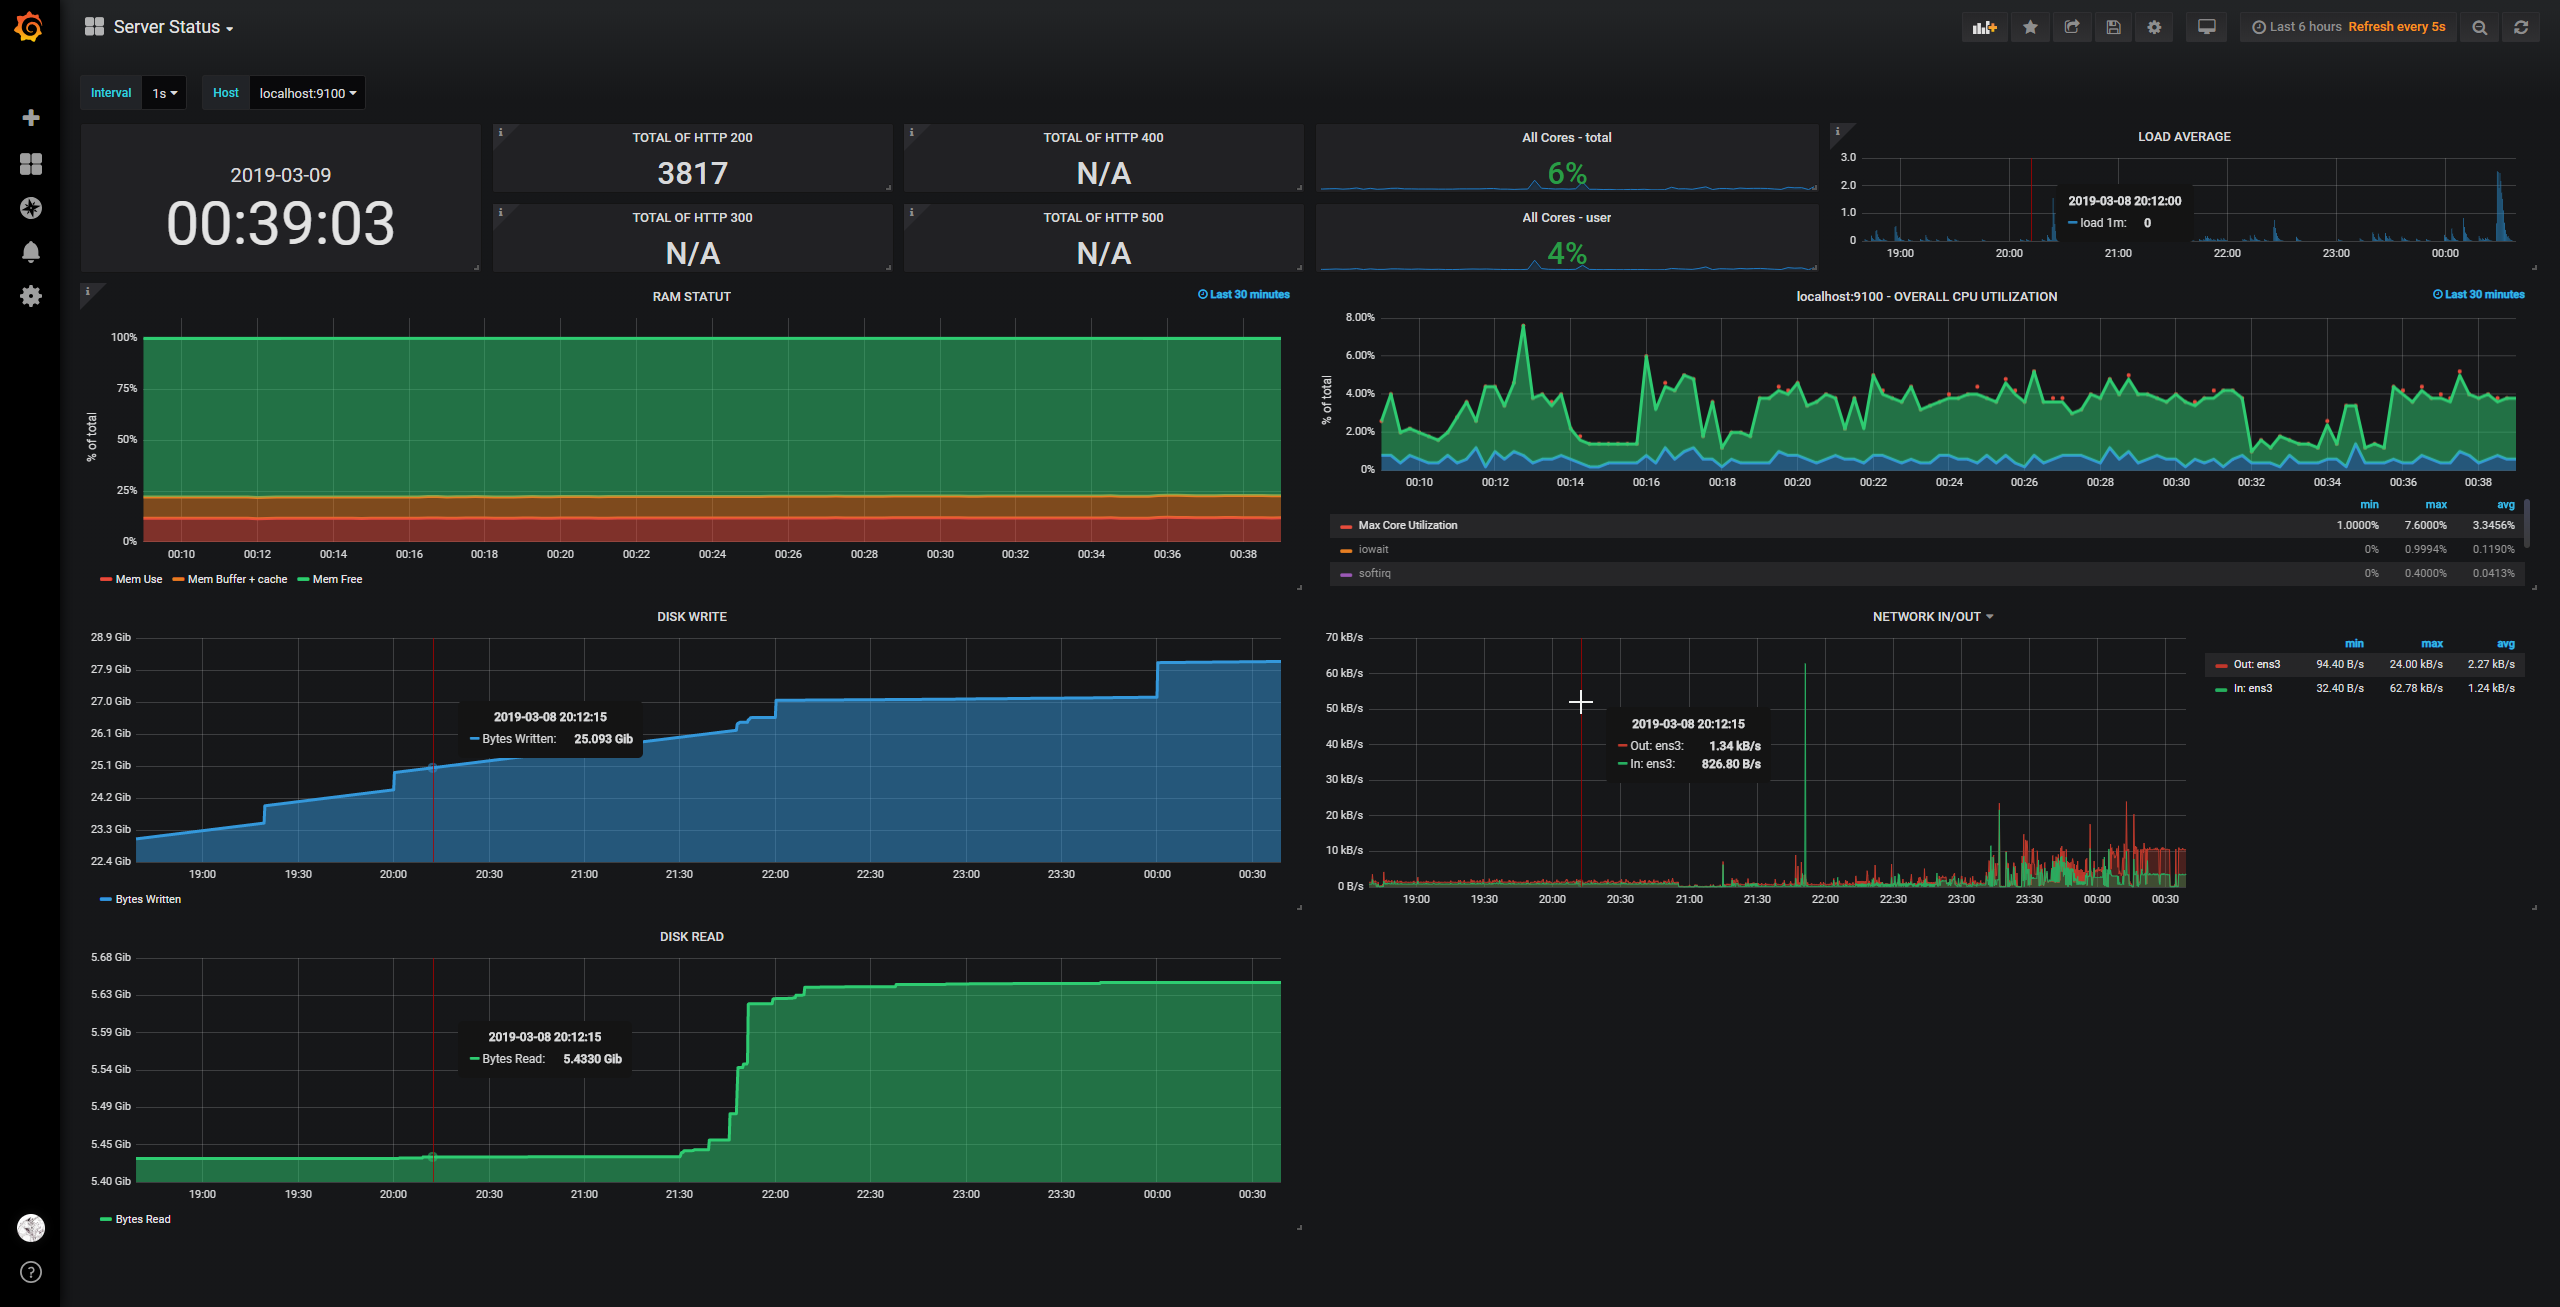
PROMETHEUS DASHBOARD
Include :
- http 200; 300; 400; 500
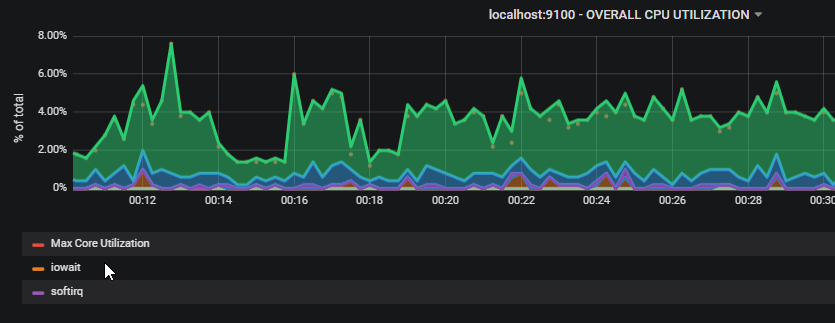
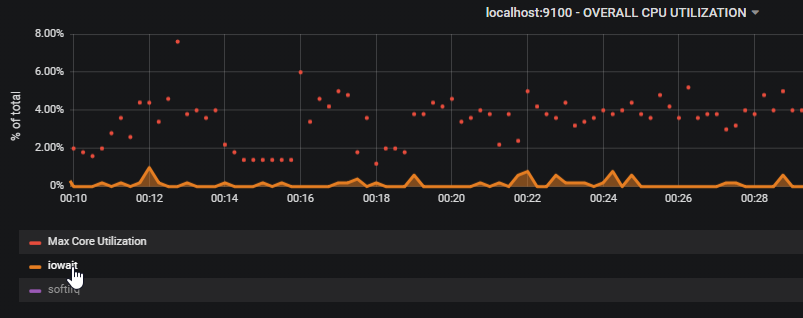
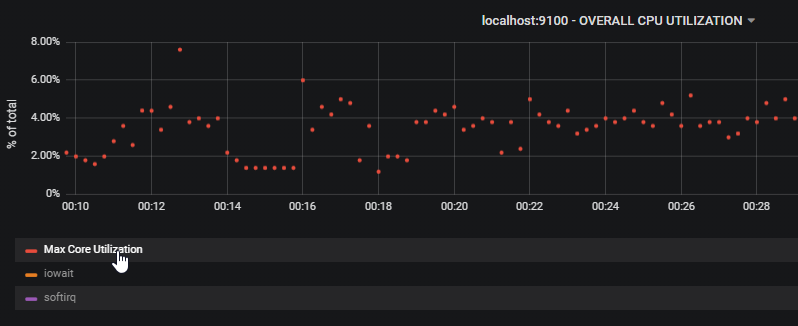
- cpu usage and overall cpu utilization filter (clik + ctrl for multiple select)
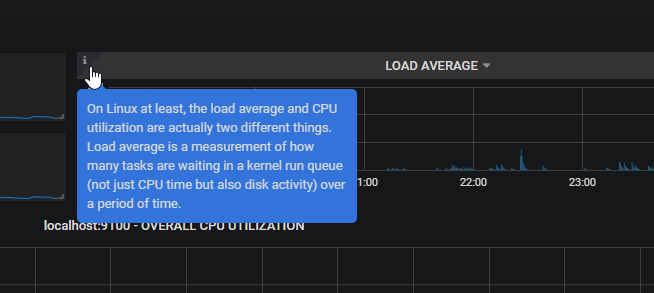
- load average
- disk write/read
- network in/out
- host choice
- interval choice
- flat color !
- and some informations in the top left corner of certain graph
install promotheus
sudo useradd --no-create-home --shell /bin/false prometheus
sudo mkdir /etc/prometheus
sudo mkdir /var/lib/prometheus
sudo chown prometheus:prometheus /etc/prometheus
sudo chown prometheus:prometheus /var/lib/prometheus
cd ~
curl -LO https://github.com/prometheus/prometheus/releases/download/v2.0.0/prometheus-2.0.0.linux-amd64.tar.gz
tar xvf prometheus-2.0.0.linux-amd64.tar.gz
sudo cp prometheus-2.0.0.linux-amd64/prometheus /usr/local/bin/
sudo cp prometheus-2.0.0.linux-amd64/promtool /usr/local/bin/
sudo chown prometheus:prometheus /usr/local/bin/prometheus
sudo chown prometheus:prometheus /usr/local/bin/promtool
sudo cp -r prometheus-2.0.0.linux-amd64/consoles /etc/prometheus
sudo cp -r prometheus-2.0.0.linux-amd64/console_libraries /etc/prometheus
sudo chown -R prometheus:prometheus /etc/prometheus/consoles
sudo chown -R prometheus:prometheus /etc/prometheus/console_libraries
rm -rf prometheus-2.0.0.linux-amd64.tar.gz prometheus-2.0.0.linux-amd64
sudo touch /etc/prometheus/prometheus.yml
sudo chown prometheus:prometheus /etc/prometheus/prometheus.yml
sudo bash -c 'cat << EOF > /etc/systemd/system/prometheus.service
[Unit]
Description=Prometheus
Wants=network-online.target
After=network-online.target
[Service]
User=prometheus
Group=prometheus
Type=simple
ExecStart=/usr/local/bin/prometheus

–config.file /etc/prometheus/prometheus.yml

–storage.tsdb.path /var/lib/prometheus/

–web.console.templates=/etc/prometheus/consoles

–web.console.libraries=/etc/prometheus/console_libraries
[Install]
WantedBy=multi-user.target
EOF'
install Prometheus node Exporter
sudo useradd --no-create-home --shell /bin/false node_exporter
cd ~
curl -LO https://github.com/prometheus/node_exporter/releases/download/v0.15.1/node_exporter-0.15.1.linux-amd64.tar.gz
tar xvf node_exporter-0.15.1.linux-amd64.tar.gz
sudo cp node_exporter-0.15.1.linux-amd64/node_exporter /usr/local/bin
sudo chown node_exporter:node_exporter /usr/local/bin/node_exporter
rm -rf node_exporter-0.15.1.linux-amd64.tar.gz node_exporter-0.15.1.linux-amd64
sudo bash -c 'cat << EOF > /etc/systemd/system/node_exporter.service
[Unit]
Description=Node Exporter
Wants=network-online.target
After=network-online.target
[Service]
User=node_exporter
Group=node_exporter
Type=simple
ExecStart=/usr/local/bin/node_exporter
[Install]
WantedBy=multi-user.target
EOF'
Configurations Prometheus + Prometheus node Exporter
sudo bash -c 'cat << EOF > /etc/prometheus/prometheus.yml
global:
scrape_interval: 15s
scrape_configs:
- job_name: 'prometheus'
scrape_interval: 5s
static_configs:
- targets: ['localhost:9090']
- job_name: 'node_exporter'
scrape_interval: 5s
static_configs:
- targets: ['localhost:9100']
EOF'
Run Prometheus + Prometheus node Exporter
sudo systemctl daemon-reload
sudo systemctl start prometheus
sudo systemctl start node_exporter
Data source config
Collector config:
Upload an updated version of an exported dashboard.json file from Grafana
| Revision | Description | Created | |
|---|---|---|---|
| Download |