
Apache Overview
Performance metrics for Apache
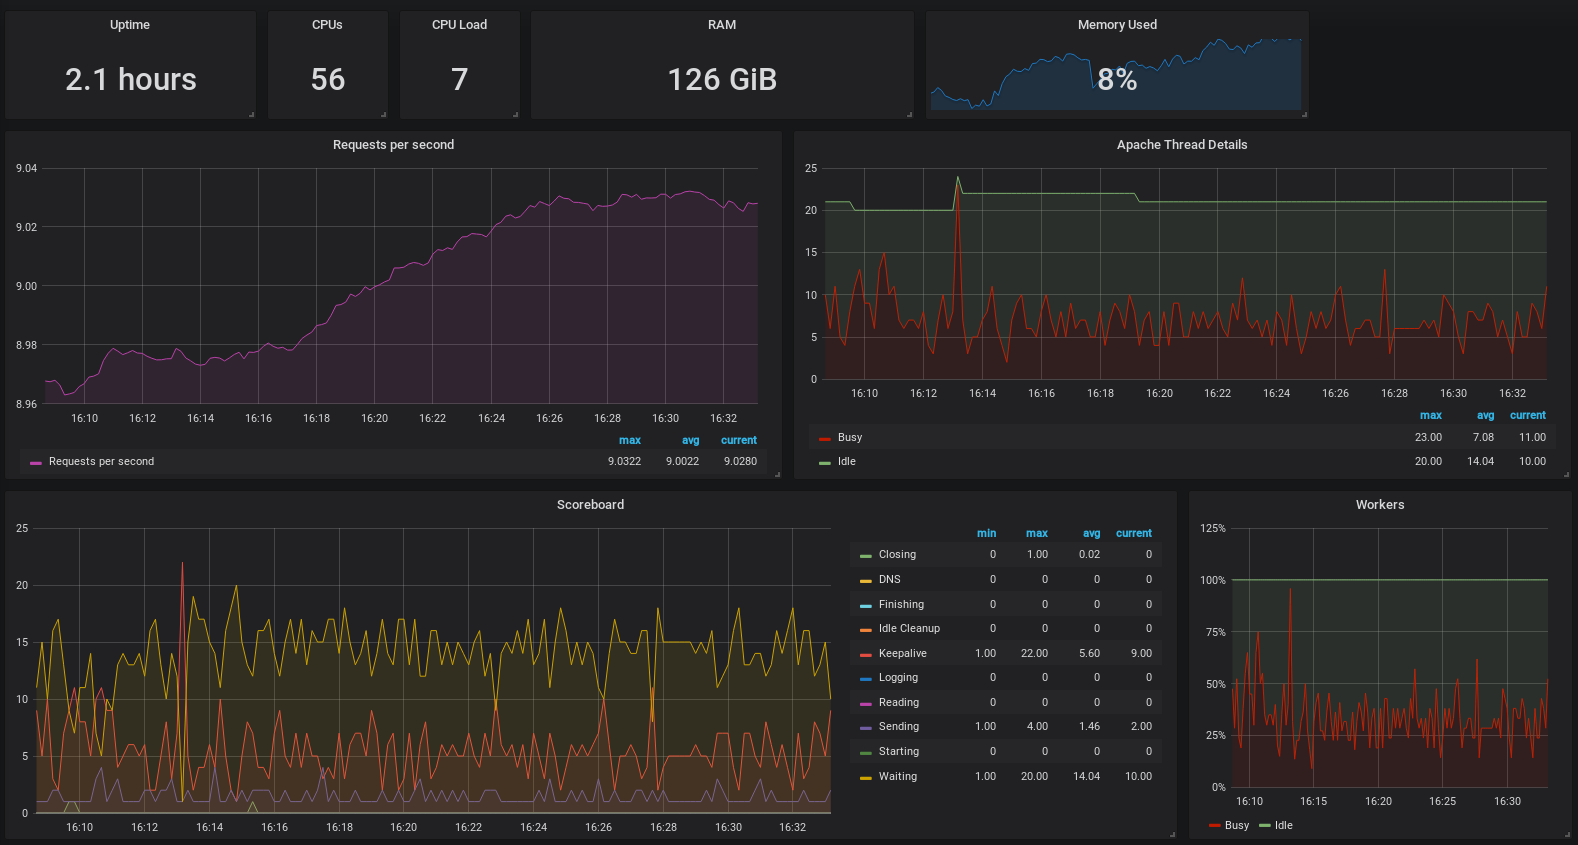
Based on the Apache Overview dashboard, i added 2 additional panels for "requests per second" and "thread details".
Data source config
Collector type:
Collector plugins:
Collector config:
Revisions
Upload an updated version of an exported dashboard.json file from Grafana
| Revision | Description | Created | |
|---|---|---|---|
| Download |