
inspectIT Ocelot - Elastic - JVM Metrics
This dashboard is an example dashboard and part of the inspectIT OCE demo. This dashboard shows JVM metrics collected with the inspectIT OCE agent and stored with Elasticsearch.
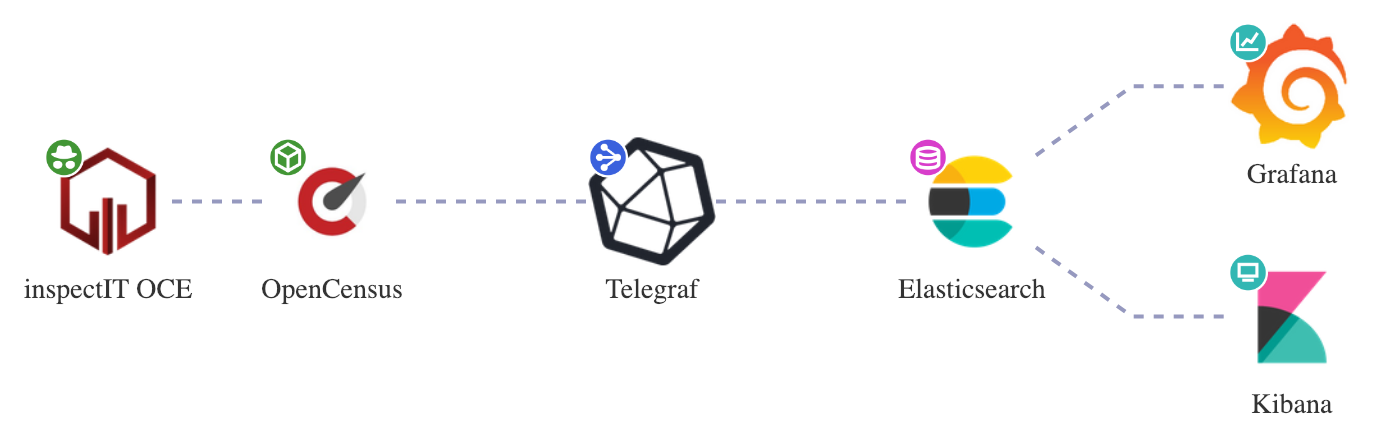
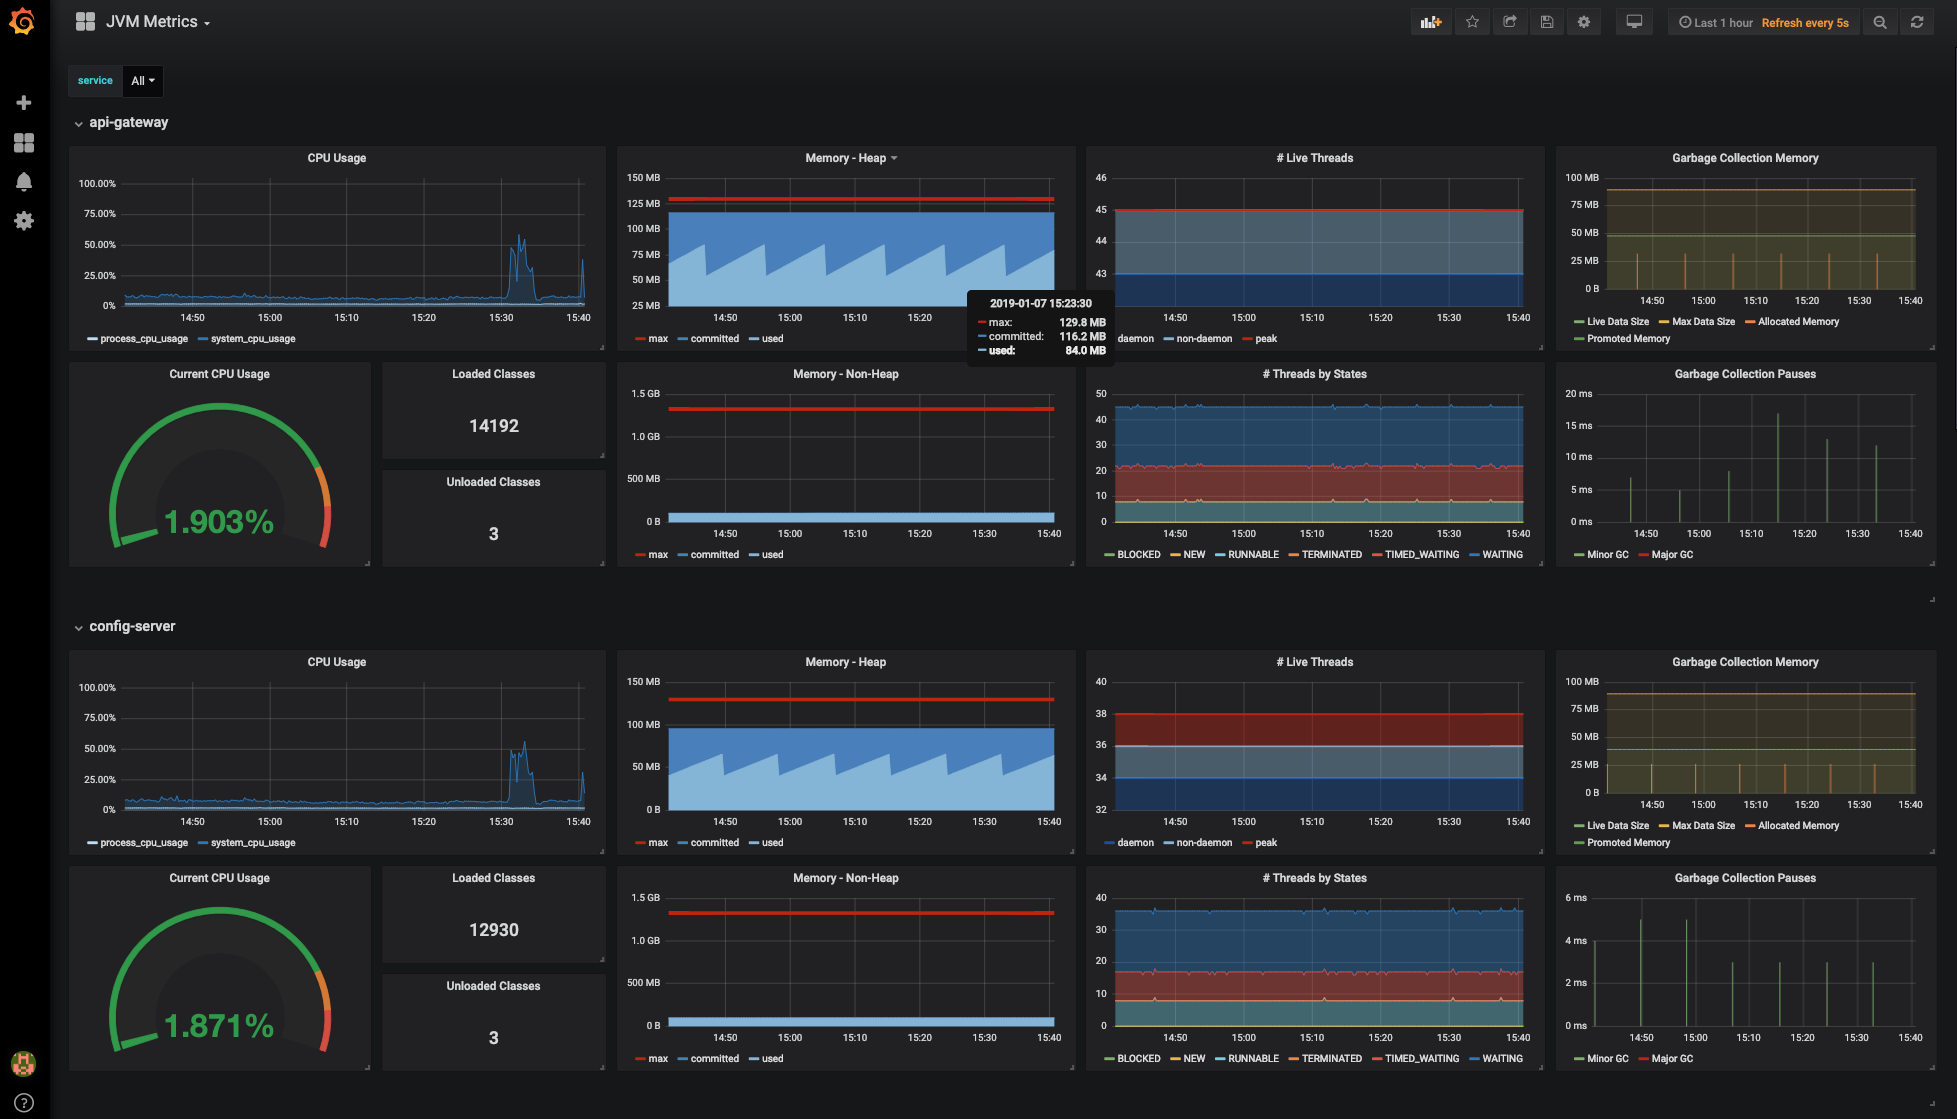
Shows JVM metrics collected by inspectIT OpenCensus Edition:
- JVM CPU metrics
- JVM memory metrics
- JVM garbage collection metrics
This dashboard is for usage with a Elasticsearch data source.
Data source config
Collector type:
Collector plugins:
Collector config:
Revisions
Upload an updated version of an exported dashboard.json file from Grafana
| Revision | Description | Created | |
|---|---|---|---|
| Download |
Java Virtual Machine (JVM)
Easily monitor a Java virtual machine, which allows computers to run Java programs, with Grafana Cloud's out-of-the-box monitoring solution.
Learn more