Docker and system monitoring
A simple overview of the most important Docker host and container metrics. (cAdvisor/Prometheus)
Docker + System dashboard
Dashboard compatible with Grafana 4
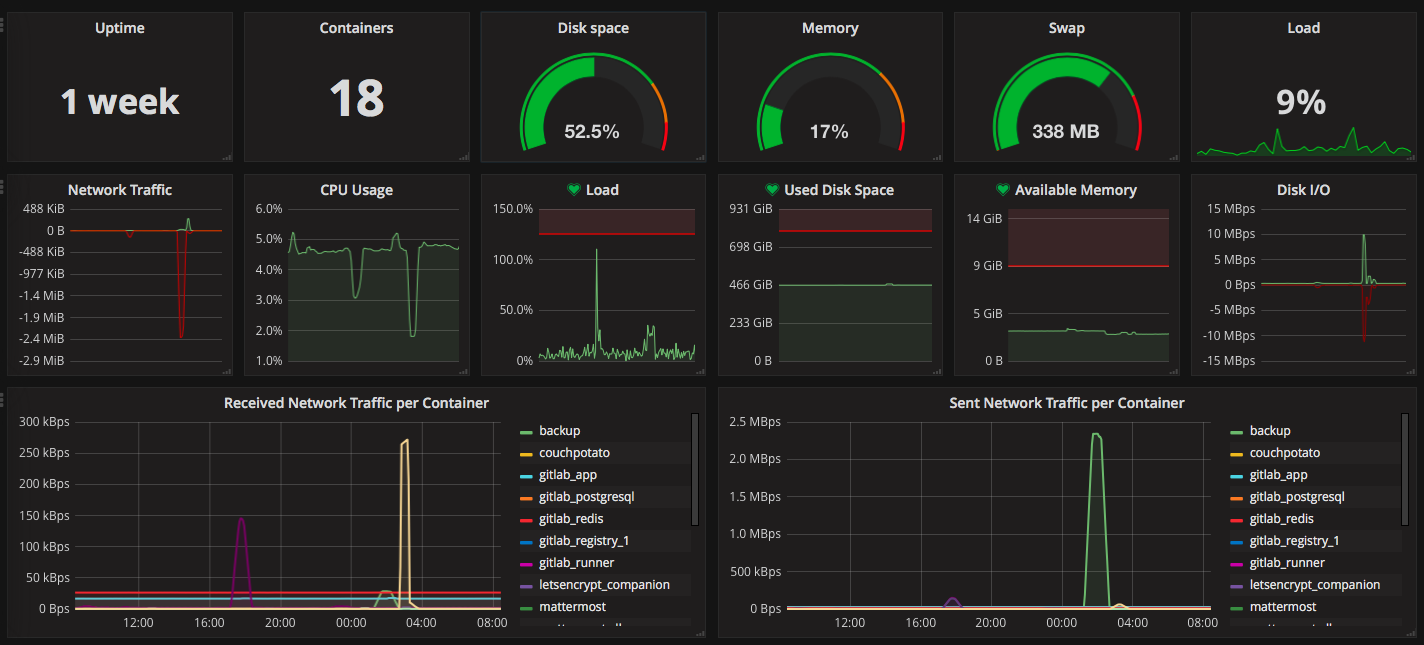
System metric
This dashboard display Docker and system metric, the aim it's to have all the metric on one dashboard. The first lines represents the system metric with gauge and text/graph (easy to visualize and minimalist).
- Time up
- Memory usage/swap
- Disk usage
- Load
- Network
- CPU usage
- Disk I/O
Alerts are set on disk usage, memory usage and load usage to warn when the metric are critics.
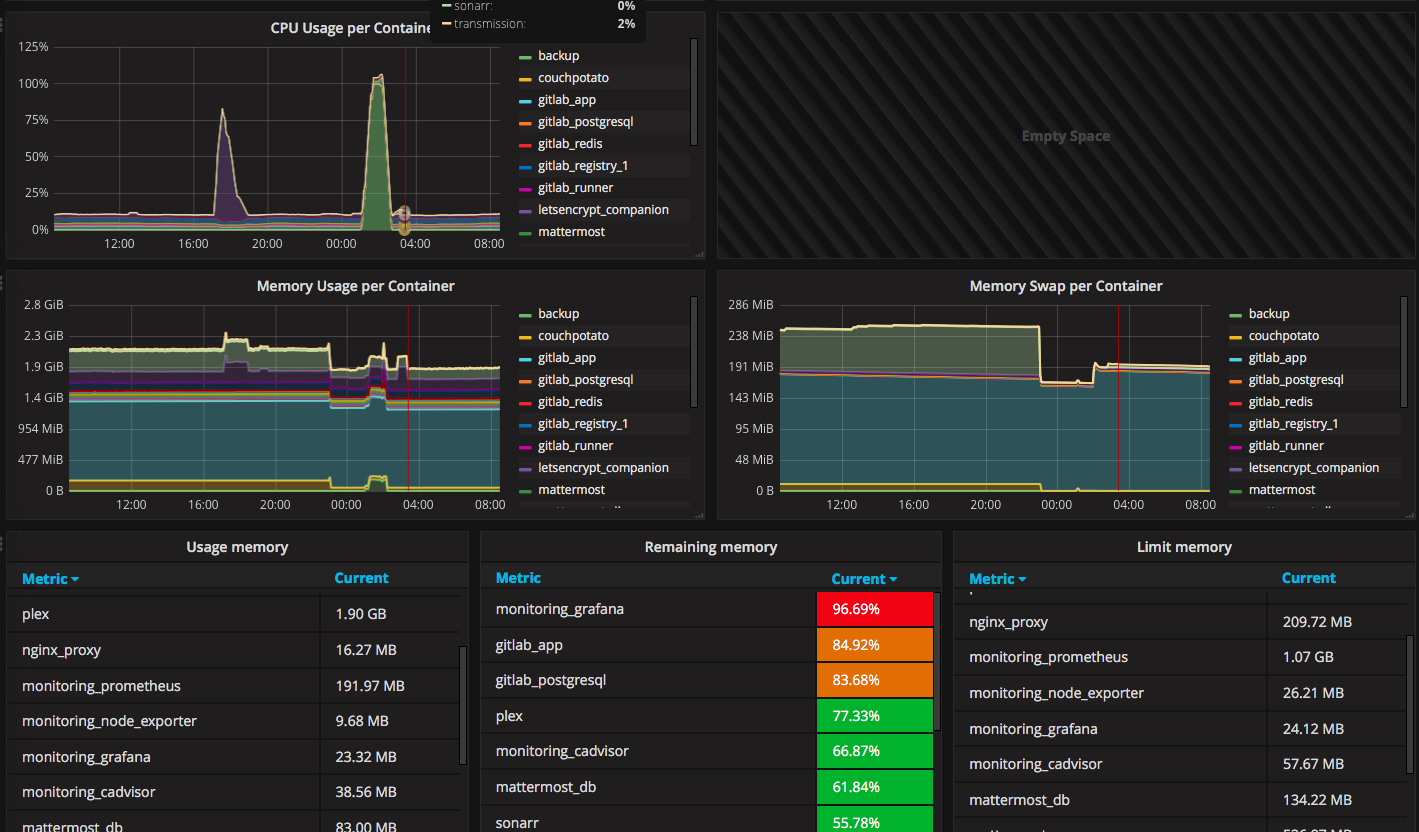
Docker metric
The second parts of the dashboard is Docker metric, more detailed using mostly graph.
- CPU usage per container
- Sent network per container
- Received network per container
- Memory usage/swap per container
- Remaining memory for each container (if men_limit defined in docker-compose.yml)
Server configuration
I use the docker-compose to set my monitoring: https://github.com/vegasbrianc/prometheus. My dashboard work with this configuration. Service running:
- docker
- prometheus
- node-exporter
- alertmanager
- cadvisor
- grafana v4
Install with docker-compose.yml
docker-compose.yml
prometheus:
    image: prom/prometheus:latest
    container_name: monitoring_prometheus
    restart: unless-stopped
    volumes:
      - ./data/prometheus/config:/etc/prometheus/
      - ./data/prometheus/data:/prometheus
    command:
      - '-config.file=/etc/prometheus/prometheus.yml'
      - '-storage.local.path=/prometheus'
      - '-alertmanager.url=http://alertmanager:9093'
    expose:
      - 9090
    ports:
      - 9090:9090
    links:
      - cadvisor:cadvisor
      - node-exporter:node-exporter
node-exporter:
image: prom/node-exporter:latest
container_name: monitoring_node_exporter
restart: unless-stopped
expose:
- 9100
cadvisor:
image: google/cadvisor:latest
container_name: monitoring_cadvisor
restart: unless-stopped
volumes:
- /:/rootfs:ro
- /var/run:/var/run:rw
- /sys:/sys:ro
- /var/lib/docker/:/var/lib/docker:ro
expose:
- 8080
grafana:
image: grafana/grafana:latest
container_name: monitoring_grafana
restart: unless-stopped
links:
- prometheus:prometheus
volumes:
- ./data/grafana:/var/lib/grafana
environment:
- GF_SECURITY_ADMIN_PASSWORD=MYPASSWORT
- GF_USERS_ALLOW_SIGN_UP=false
- GF_SERVER_DOMAIN=myrul.com
- GF_SMTP_ENABLED=true
- GF_SMTP_HOST=smtp.gmail.com:587
- GF_SMTP_USER=myadrress@gmail.com
- GF_SMTP_PASSWORD=mypassword
- GF_SMTP_FROM_ADDRESS=myaddress@gmail.com
prometheus.yml
# my global config
global:
scrape_interval: 120s # By default, scrape targets every 15 seconds.
evaluation_interval: 120s # By default, scrape targets every 15 seconds.
# scrape_timeout is set to the global default (10s).
Attach these labels to any time series or alerts when communicating with
external systems (federation, remote storage, Alertmanager).
external_labels:
monitor: 'my-project'
Load and evaluate rules in this file every 'evaluation_interval' seconds.
rule_files:
- "alert.rules"
- "first.rules"
- "second.rules"
A scrape configuration containing exactly one endpoint to scrape:
Here it's Prometheus itself.
scrape_configs:
The job name is added as a label job=<job_name> to any timeseries scraped from this config.
-
job_name: 'prometheus'
Override the global default and scrape targets from this job every 5 seconds.
scrape_interval: 120s
metrics_path defaults to '/metrics'
scheme defaults to 'http'.
static_configs:
- targets: ['localhost:9090','cadvisor:8080','node-exporter:9100', 'nginx-exporter:9113']
Start your docker
Run docker-compose up -d
Data source config
Collector config:
Upload an updated version of an exported dashboard.json file from Grafana
| Revision | Description | Created | |
|---|---|---|---|
| Download |
Docker
Easily monitor Docker with Grafana Cloud's out-of-the-box monitoring solution.
Learn more