
Akka HTTP - Kamon HTTP
Akka Http via Kamon HTTP
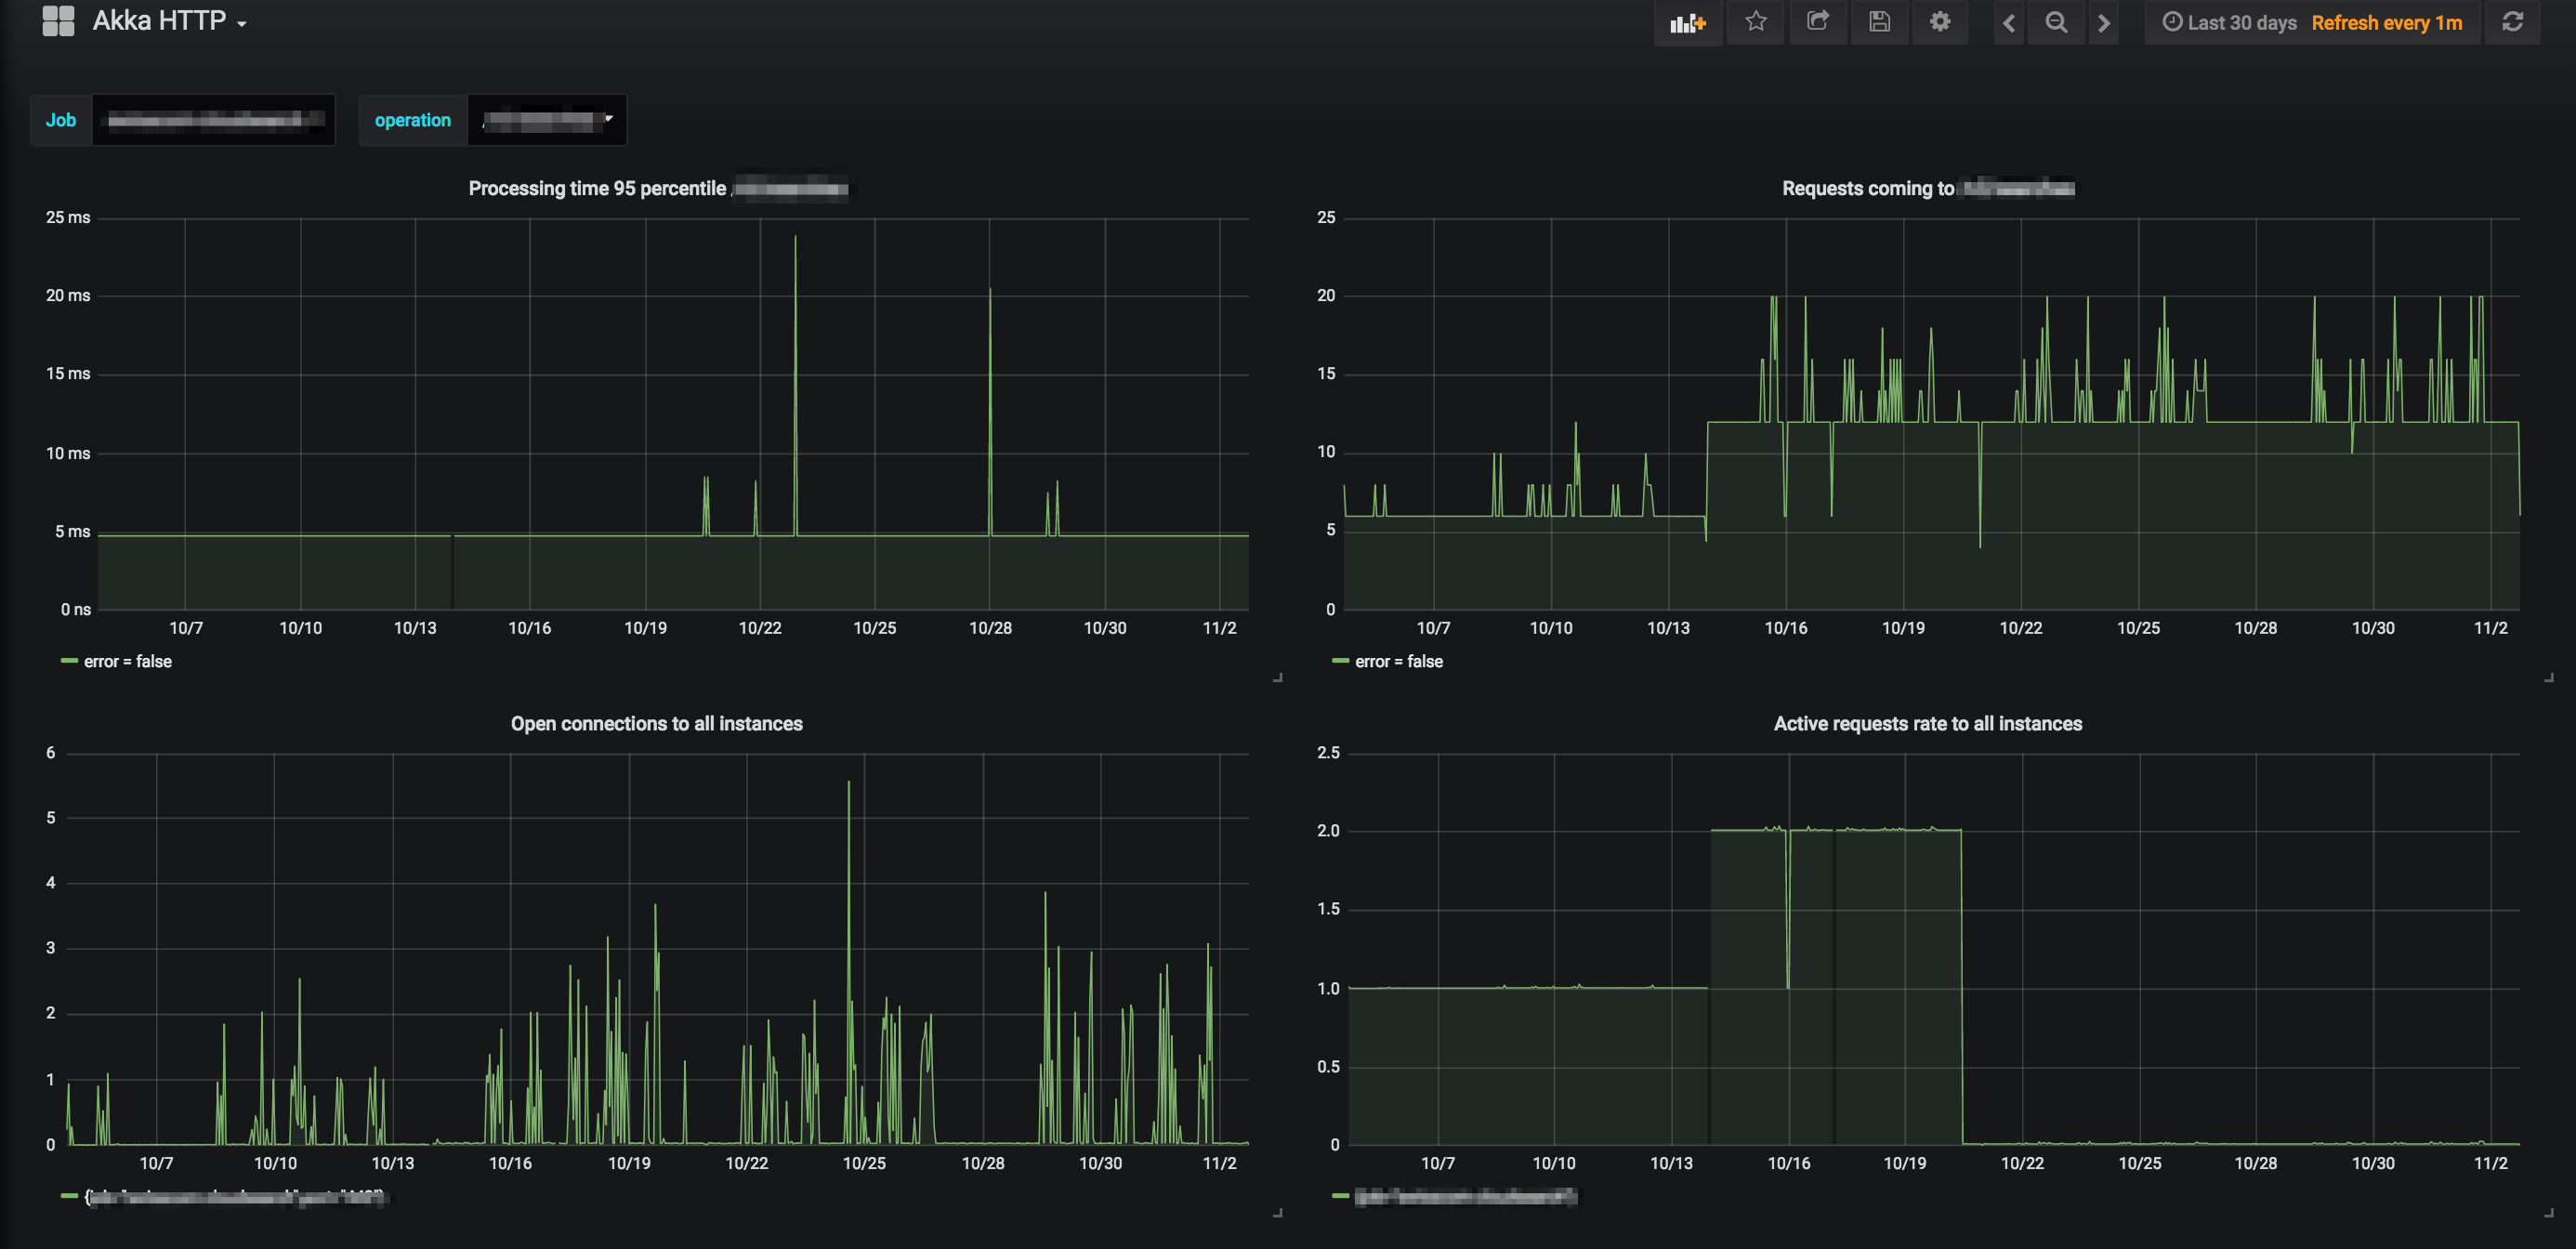
This dashbord depicts just basic Akka HTTP metrics collected by Kamon Http (1.x.x) module which are usually exposed via Kamon Prometheus Reporter and scraped by Prometheus.
If you would like to improve it https://github.com/jaksky/kamon-grafana-dashboards
Data source config
Collector type:
Collector plugins:
Collector config:
Revisions
Upload an updated version of an exported dashboard.json file from Grafana
| Revision | Description | Created | |
|---|---|---|---|
| Download |
Apache HTTP Server
Easily monitor Apache HTTP Server, an open source HTTP server for modern operating systems including UNIX and Windows, with Grafana Cloud's out-of-the-box monitoring solution.
Learn more