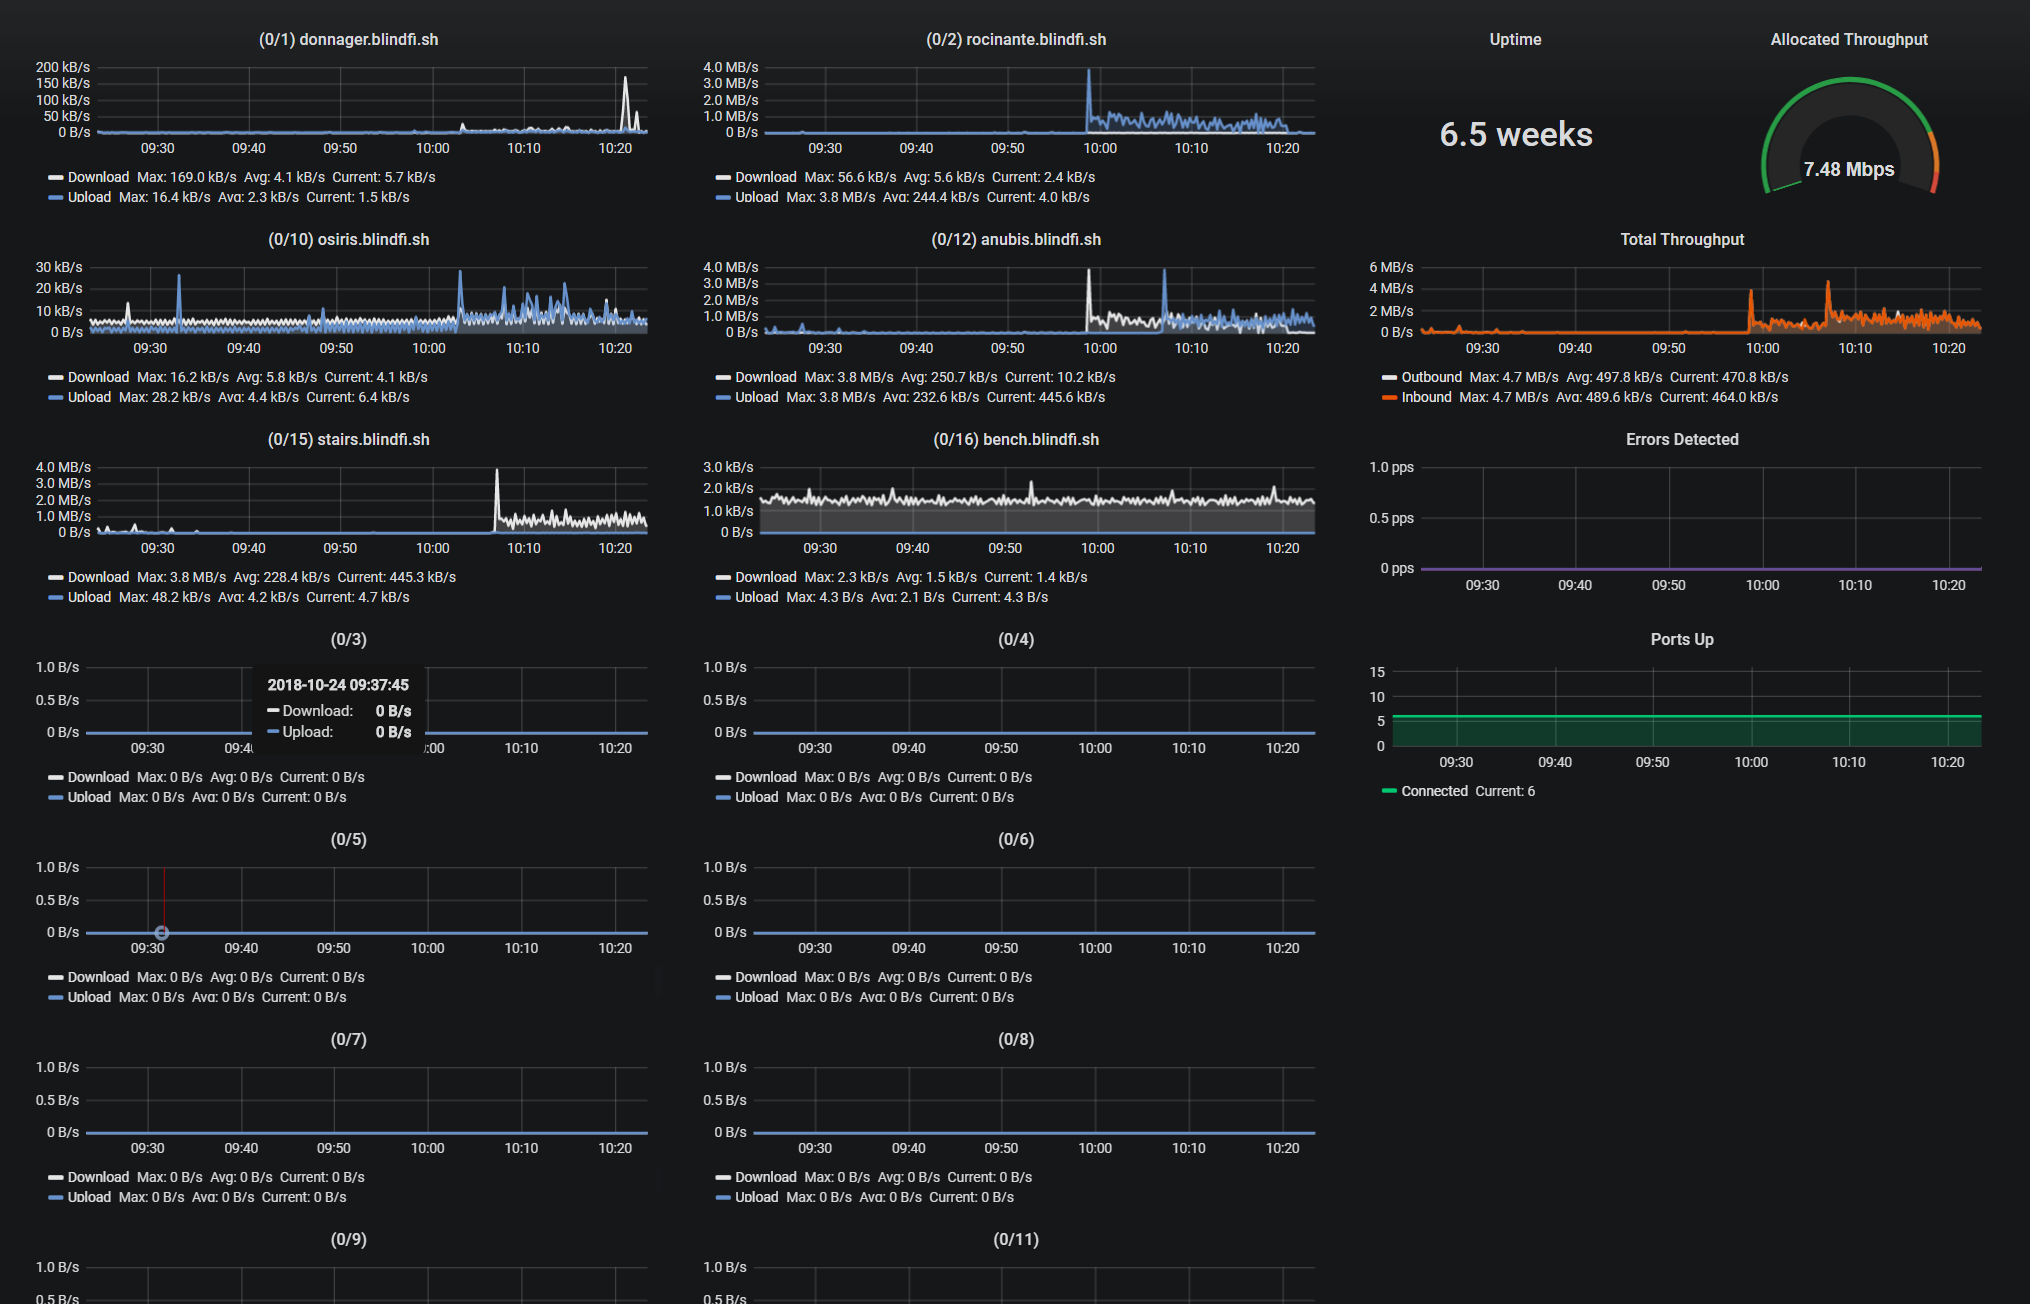
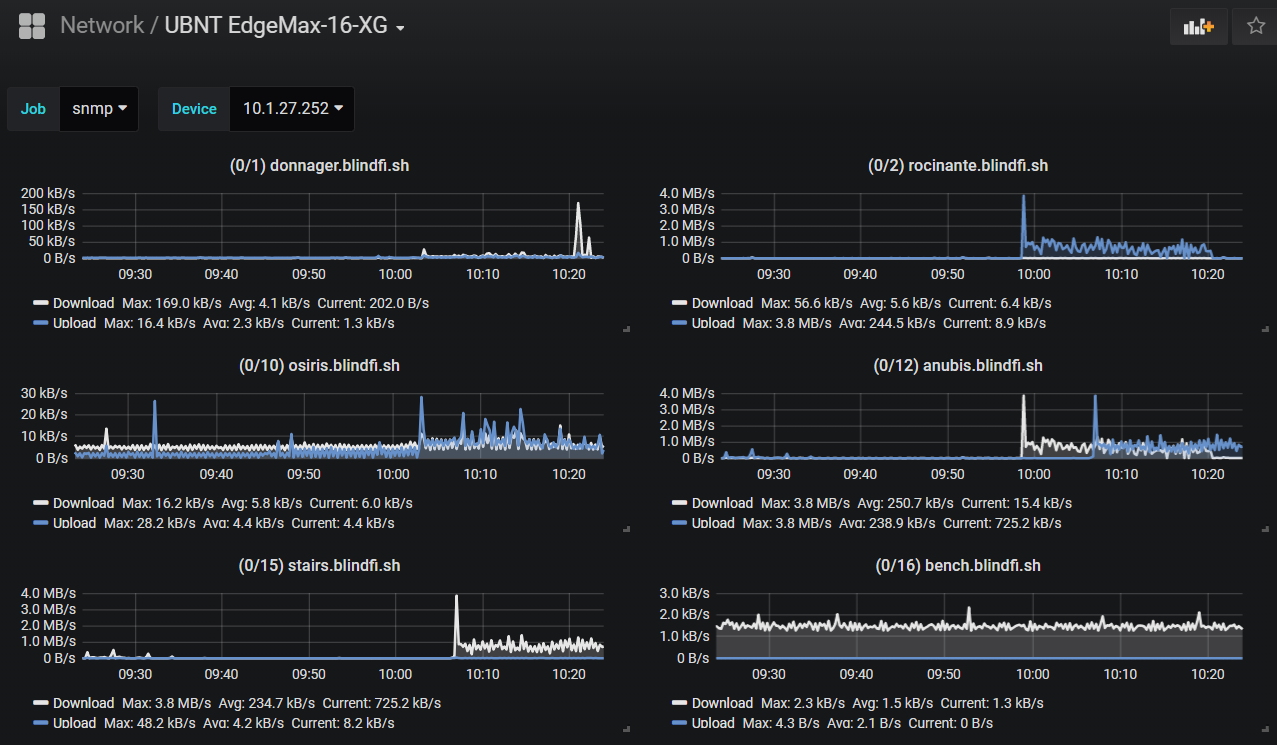
SNMP Interface Throughput (Ubiquiti EdgeMax-16-XG)
Port statistics for my Ubiquiti EdgeMax-16-XG switch. Should work with most switches.
Some minor customization required!
1). The ports are named and sorted manually. Please edit each panel to change the names and drag them around as you see fit. By default, the panel names and order reflect my environment and will not match yours.
2). If your switch has more or fewer than 16 ports, you'll need to add or remove panels accordingly. Usually, ifIndex of 1 = port 0/1, but you should manually query a list of ifName{} to verify ifindex matches.
3). The total throughput of my switch is 160Gbps. Edit the "Allocated Throughput" panel > Options > change Max and Thresholds. Look at your switch documentation to learn what the total throughput of your switch should be.
Installation:
- Tested with snmp_exporter 0.13.0: https://github.com/prometheus/snmp_exporter
- Built snmp.yaml config with generator: https://github.com/prometheus/snmp_exporter/tree/master/generator
- If using an Ubiquiti switch, set module to either "ubiquiti_unify" or"ubiquiti_airmax" (configure this param in the job in prometheus.yml)
- Enable snmp v1 as public community on switch. (Recommendation: bind to local IP and only allow connections from your local network.)
- See here: https://www.robustperception.io/snmp-monitoring-with-prometheus
Troubleshooting:
- Make sure snmp data is working through snmp_exporter. Default is: http://localhost:9116/
- Use snmpwalk cmd on Prometheus server to test connection to switch. Example: snmpwalk -c public -v1 10.0.0.2 | less
Tweet questions, fixes or ideas to me @gtwy
Data source config
Collector config:
Upload an updated version of an exported dashboard.json file from Grafana
| Revision | Description | Created | |
|---|---|---|---|
| Download |
SNMP
Easily monitor any generic SNMP (Simple Network Management Protocol) device with Grafana Cloud's out-of-the-box monitoring solution.
Learn more

