Carbon C Relay
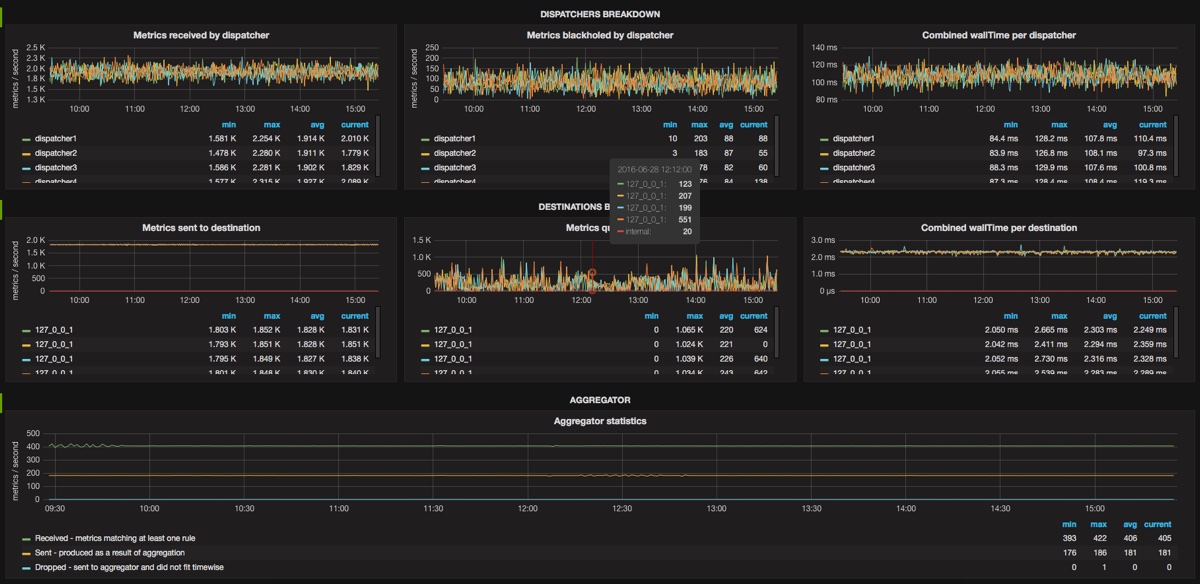
Dashboard that shows carbon-c-relay statistics.
Usage and prefix
There is no need for any configuration, since carbon-c-relay is sending it's statistics by default. Default prefix is carbon.relays.<hostname>.*
Dashboard is as generic as possible and I tried to use variables where possible.
Metrics explained
There is a link on the top right corner, that takes you carbon-c-relay github repo where all metrics are explained in details.
ChangeLog
- Rev 1: Initial upload
- Rev 2: Replace dispatchers state graph with dispatchers busyness
Make it better
For all ideas and ways to make it better, please open an issue and I'll do my best to make it better: https://github.com/matejzero/grafana-dashboards
Data source config
Collector config:
Upload an updated version of an exported dashboard.json file from Grafana
| Revision | Description | Created | |
|---|---|---|---|
| Download |


