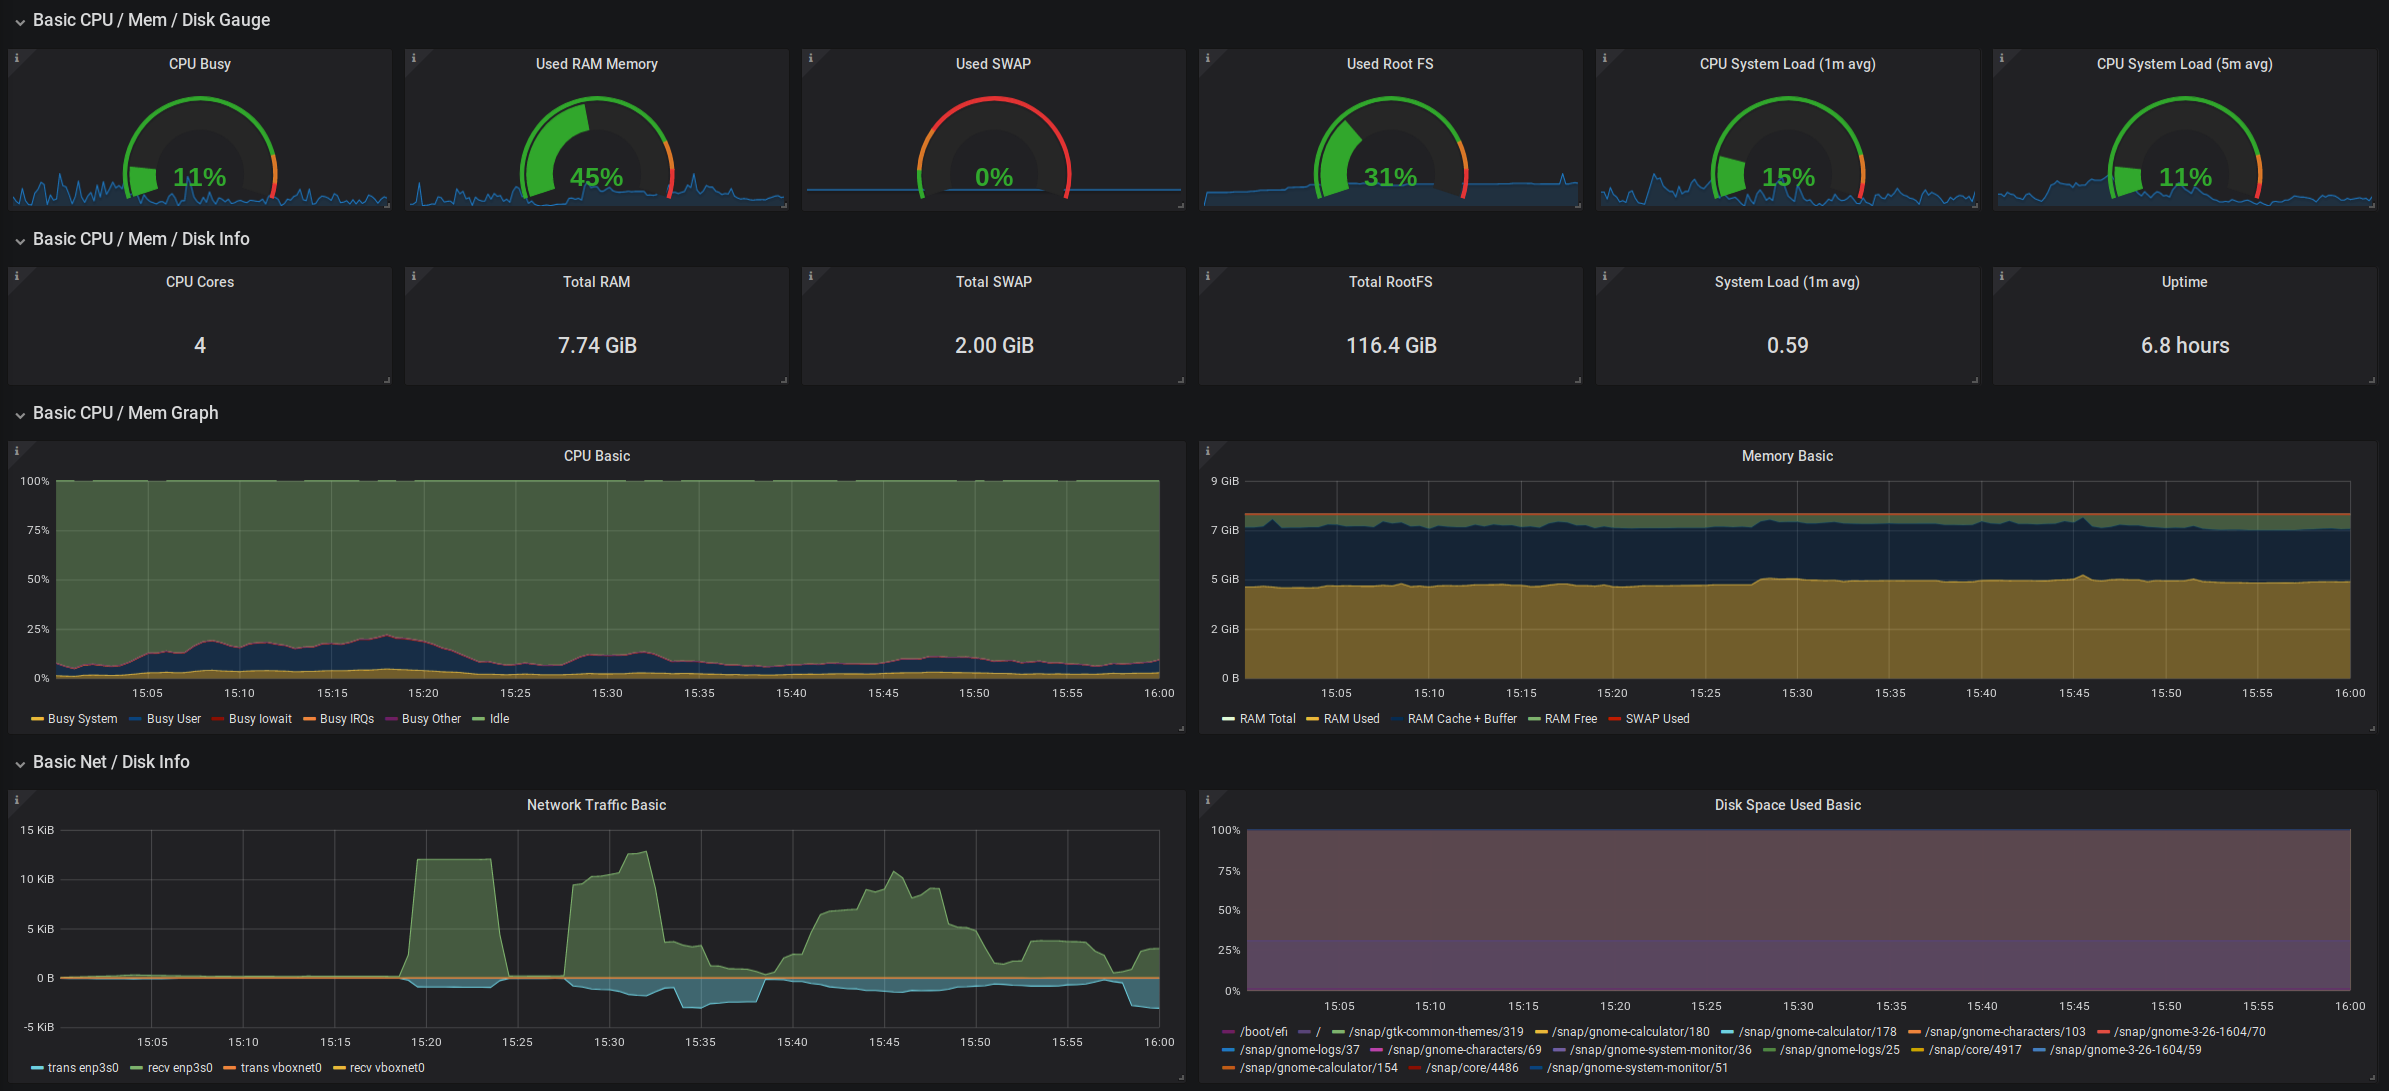
Node Exporter Full 0.15
Updated metrics name, to comply with Prometheus2.1 Dashboard from https://github.com/rfrail3/grafana-dashboards with updated metrics names for Node Exporter 0.15 version. In templating changed metric name to find hosts.
Tested on Ubuntu 18.04:
prometheus-node-exporter 0.15.2+ds (Ubuntu 18.04 default)
prometheus 2.1.0
grafana 5.2.1
Removed 5 panels due to discontinued metrics:
node_netstat_TcpExt_TCPPrequeued - lost
node_netstat_TcpExt_TCPPrequeueDropped - lost
node_netstat_TcpExt_TCPDirectCopyFromBacklog - lost
node_netstat_TcpExt_TCPDirectCopyFromPrequeue - lost
node_vmstat_nr_alloc_batch - lost
src: https://github.com/prometheus/node_exporter/issues/830#issuecomment-380100059
Data source config
Collector config:
Upload an updated version of an exported dashboard.json file from Grafana
| Revision | Description | Created | |
|---|---|---|---|
| Download |
Linux Server
Monitor Linux with Grafana. Easily monitor your Linux deployment with Grafana Cloud's out-of-the-box monitoring solution.
Learn more