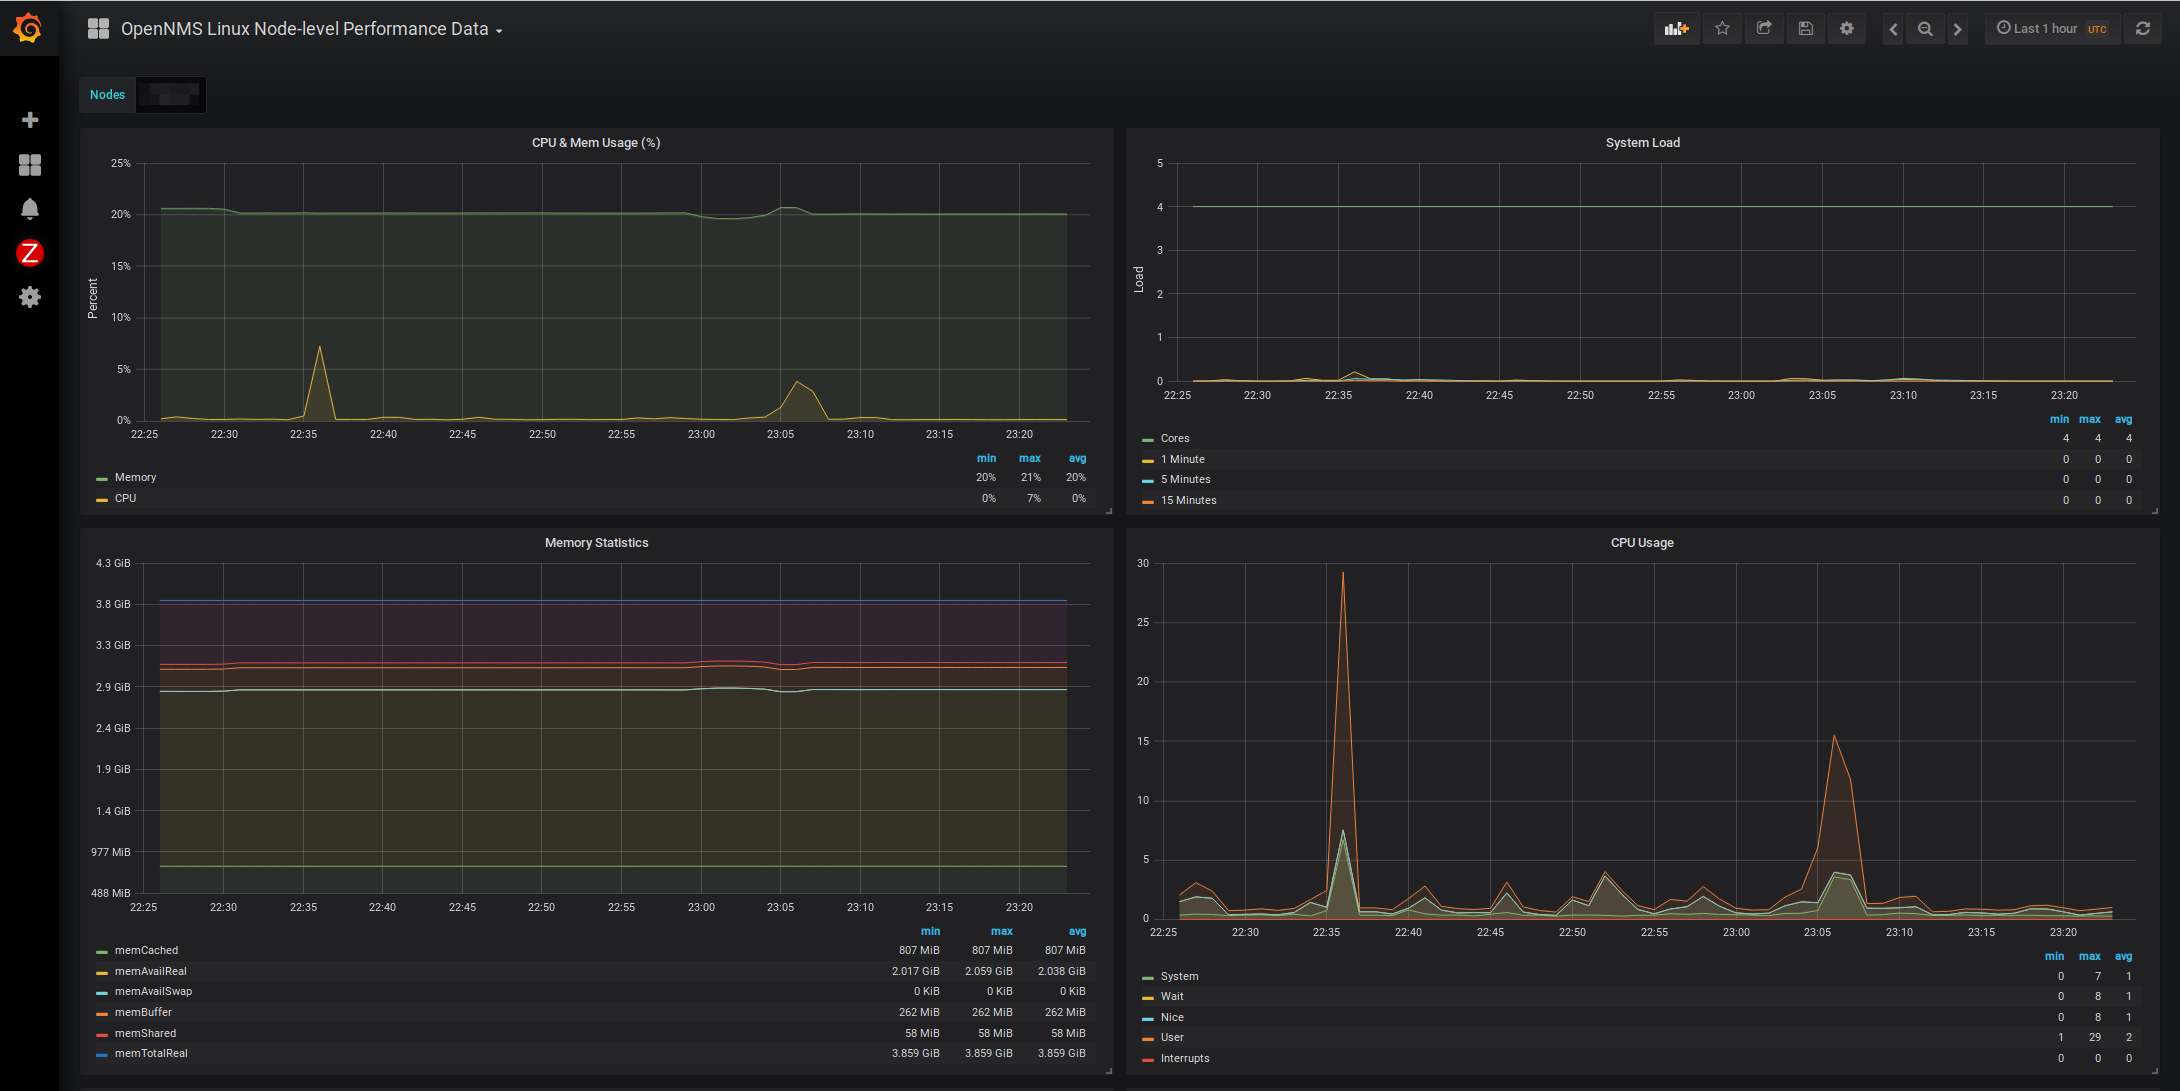
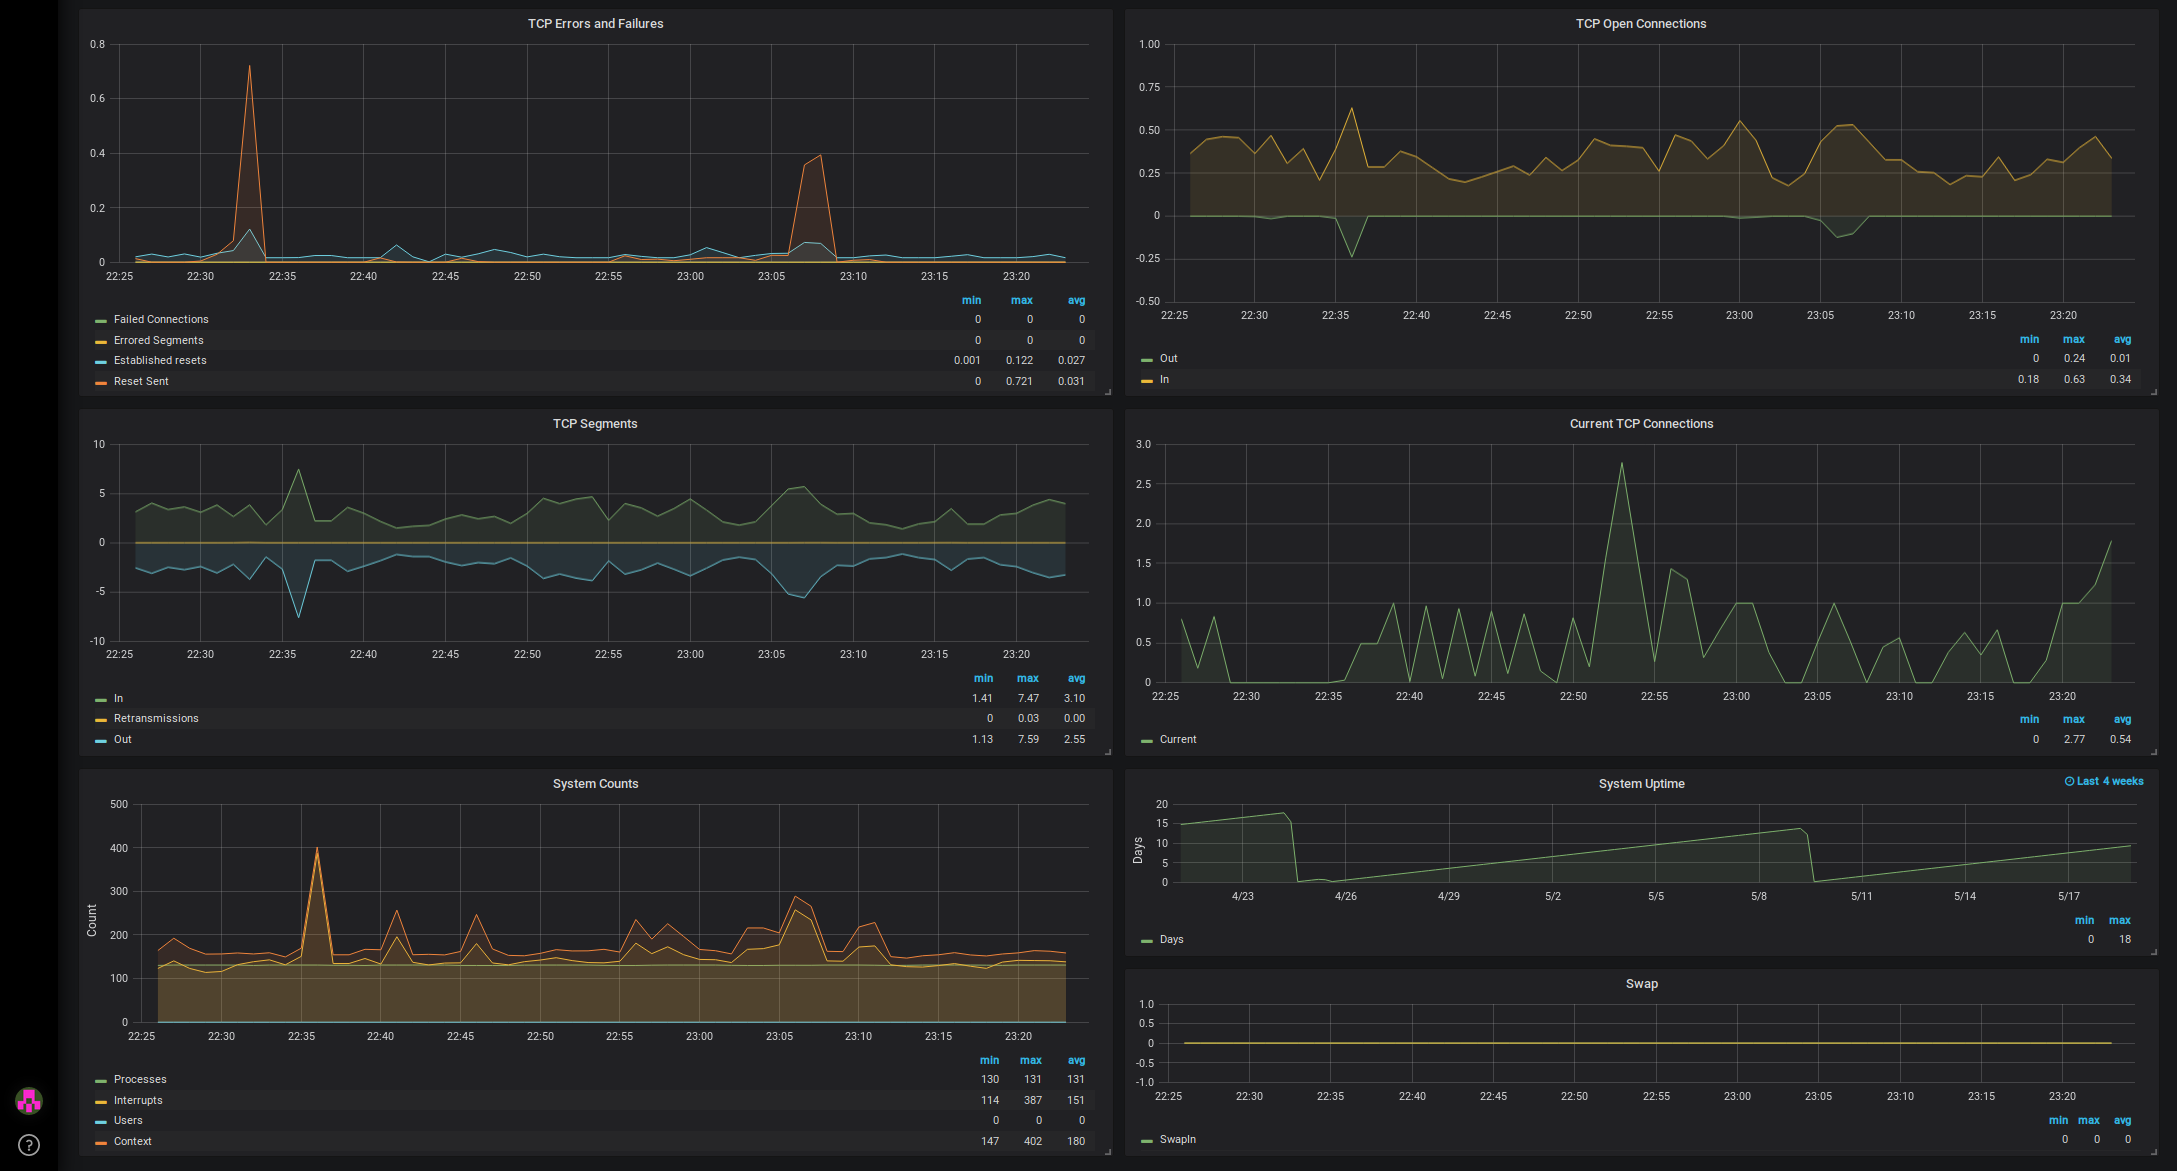
OpenNMS Linux Node-level Performance Data
Grafana pendant for Node-Level Performance Data KSC graphs
- See all Linux node metrics in one dashboard
- Nodes get selected by using the nodeFilter: nodeSysOID LIKE '.1.3.6.1.4.1.8072.3.2.10' & serviceName like 'SNMP'
- Memory statistics graph is configured to use the new memory definition. See here: https://askubuntu.com/questions/770108/what-do-the-changes-in-free-output-from-14-04-to-16-04-mean
- netsnmp 5.7.3 is required on client side because of ssCpuNumCpus metric for load graph
- Uptime graph is set to 4 weeks range to get an idea if reboots happend
If you find errors or have enhancements, feel free to create a pull request in our Github repo: https://github.com/opennms-forge/grafana-dashboards/tree/master/Linux-Performance-Node-Level
Data source config
Collector config:
Upload an updated version of an exported dashboard.json file from Grafana
| Revision | Description | Created | |
|---|---|---|---|
| Download |
Linux Server
Monitor Linux with Grafana. Easily monitor your Linux deployment with Grafana Cloud's out-of-the-box monitoring solution.
Learn more

