redis.JPG javastaacksumm.JPG tomcat.JPG redis.JPG apache.JPG
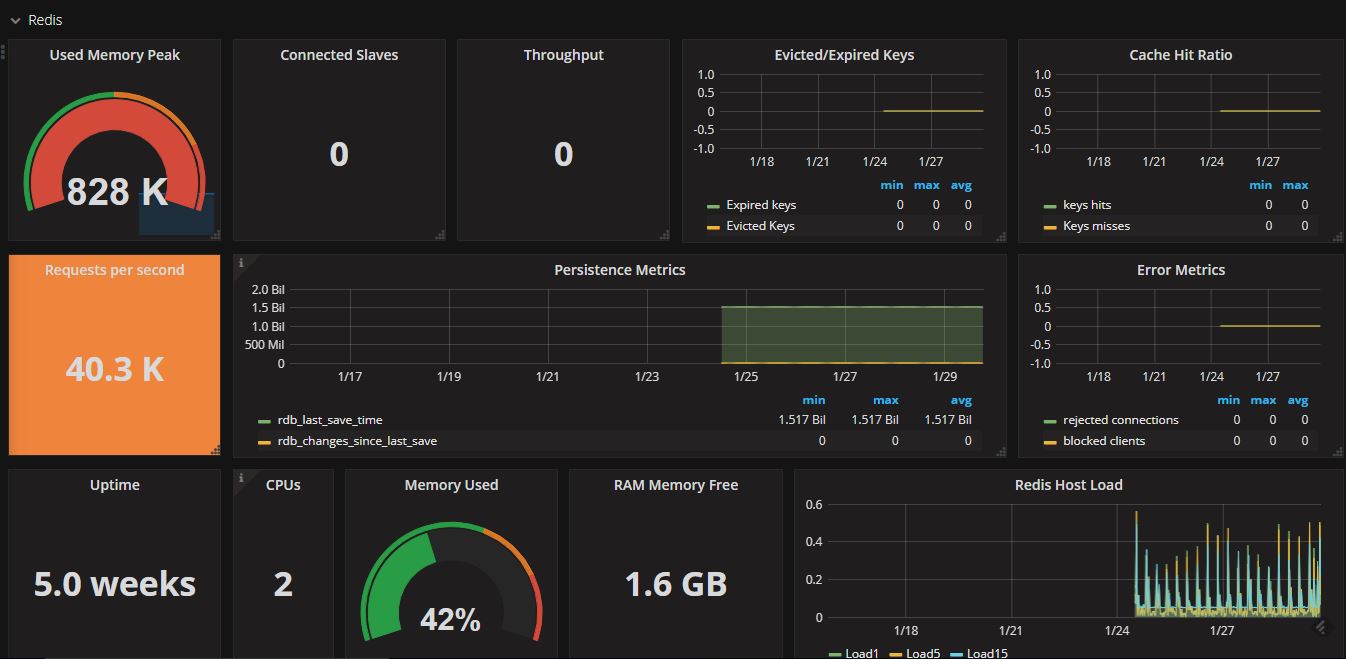
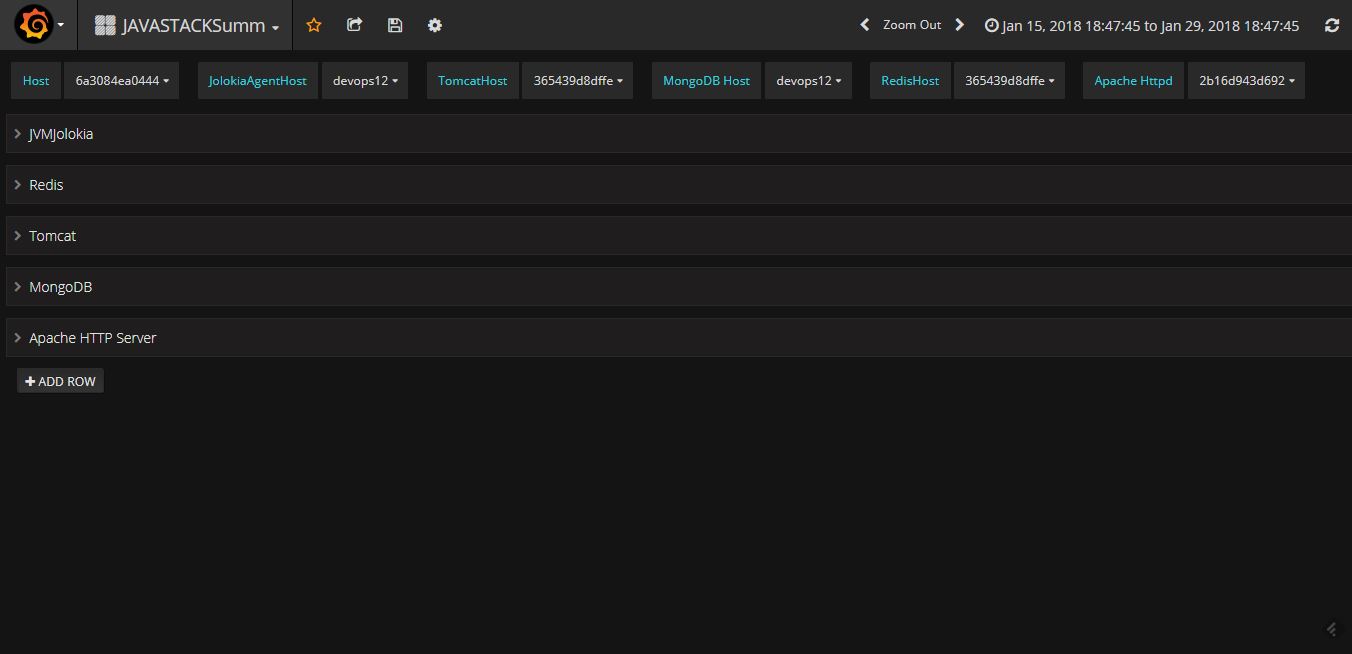
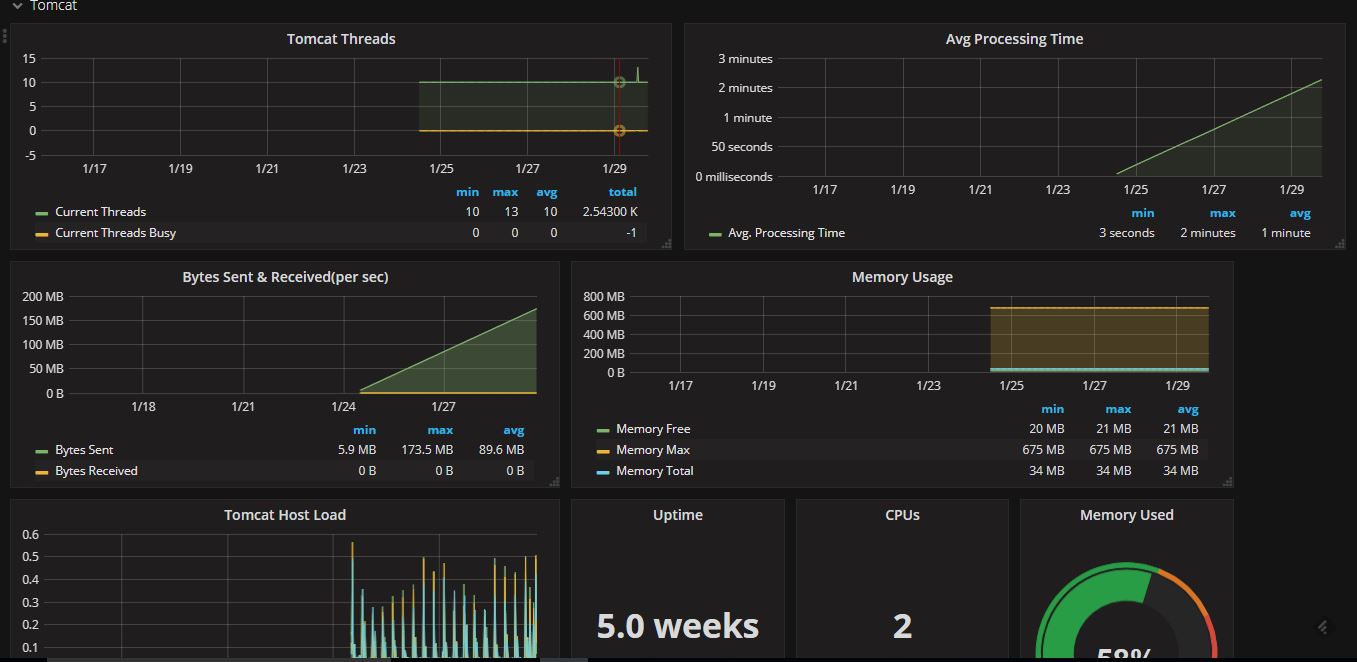
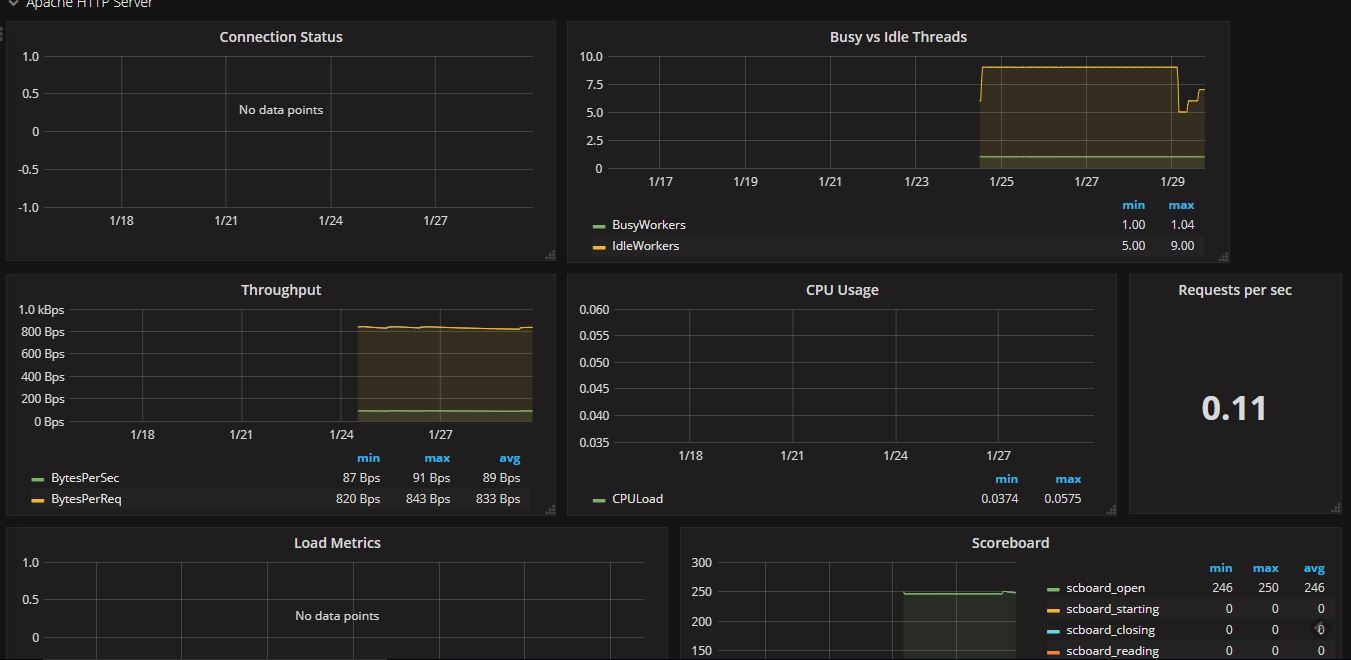
This dashboard collects metrics using telegraf and stores in InfluxDB . This dashboard contains key metrics for monitoring the components widely used in Java stack - redis, apache httpd, tomcat, mongodb, jolokia jvm and system host metrics.
Collector Configuration Details
[[inputs.cpu]] percpu = false totalcpu = true fielddrop = ["time_*"]
[[inputs.diskio]] skip_serial_number = true
[[inputs.disk]]
[[inputs.mem]]
[[inputs.processes]]
[[inputs.swap]]
[[inputs.docker]] endpoint = "unix:///var/run/docker.sock" container_names = [] timeout = "5s" docker_label_include = [] docker_label_exclude = []
[[inputs.kernel]]
[[inputs.system]] [inputs.system.tags] n_cpus = "%N_CPUS%"
[[inputs.net]] interfaces = ["eth0"] [inputs.net.tagdrop] interface = ["all"]
[[inputs.net_response]] protocol = "tcp" address = ":80"
[[inputs.net_response]] protocol = "tcp" address = ":3000"
[[inputs.net_response]] protocol = "tcp" address = ":8086"
tagexclude = ["server"]
[[inputs.jolokia]] context = "/jolokia/"
[[inputs.jolokia.servers]] name = "as-server-01" host = "x.x.x.x" port = "8080"
[[inputs.jolokia.metrics]] name = "heap_memory_usage" mbean = "java.lang:type=Memory" attribute = "HeapMemoryUsage"
[[inputs.jolokia.metrics]] name = "thread_count" mbean = "java.lang:type=Threading" attribute = "TotalStartedThreadCount,ThreadCount,DaemonThreadCount,PeakThreadCount"
[[inputs.jolokia.metrics]] name = "class_count" mbean = "java.lang:type=ClassLoading" attribute = "LoadedClassCount,UnloadedClassCount,TotalLoadedClassCount" [[inputs.redis]] servers = ["tcp://x.x.x.x:6379"]
[[inputs.tomcat]] url = "http://x.x.x.x:8080/manager/status/all?XML=true" username = "tommy" password = "s3cret"
[[inputs.redis]] servers = ["tcp://{{ RedisIP }}:6379"] [inputs.mongodb] servers = ["mongodb://{{ MongoDBIP }}:27017"] gather_perdb_stats = false