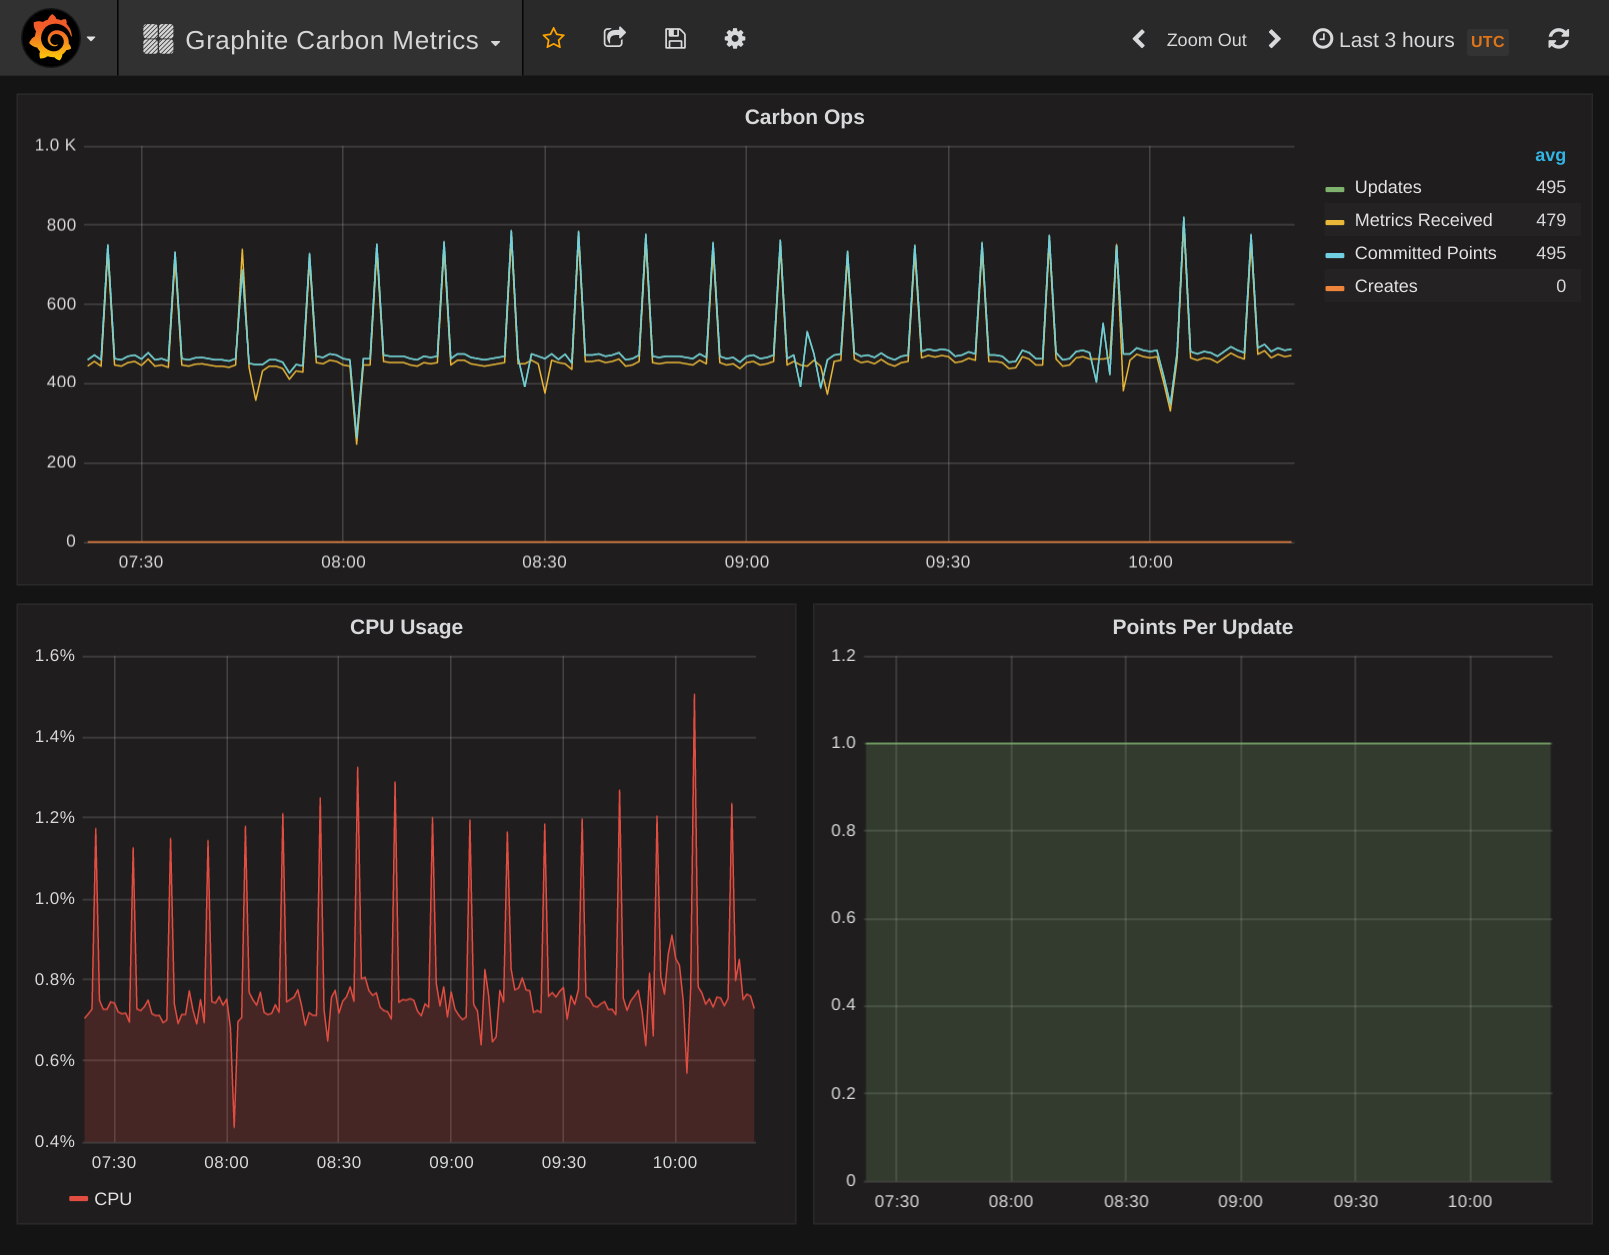
Graphite Carbon Metrics
Simple Carbon agent overview dashboard.
Graph Panels
- Updates, Creates, Metrics Received, Committed Points
- CPU Usage
- Points Per Update
Help Make this dashboard better
For feedback and ideas to improve this dashboard please open an issue here: https://github.com/torkelo/dashboards
Data source config
Collector config:
Upload an updated version of an exported dashboard.json file from Grafana
| Revision | Description | Created | |
|---|---|---|---|
| Download |

