Icinga2 with InfluxDB
Icinga2 & InfluxDB Dashboard
Icinga2 Dashboard
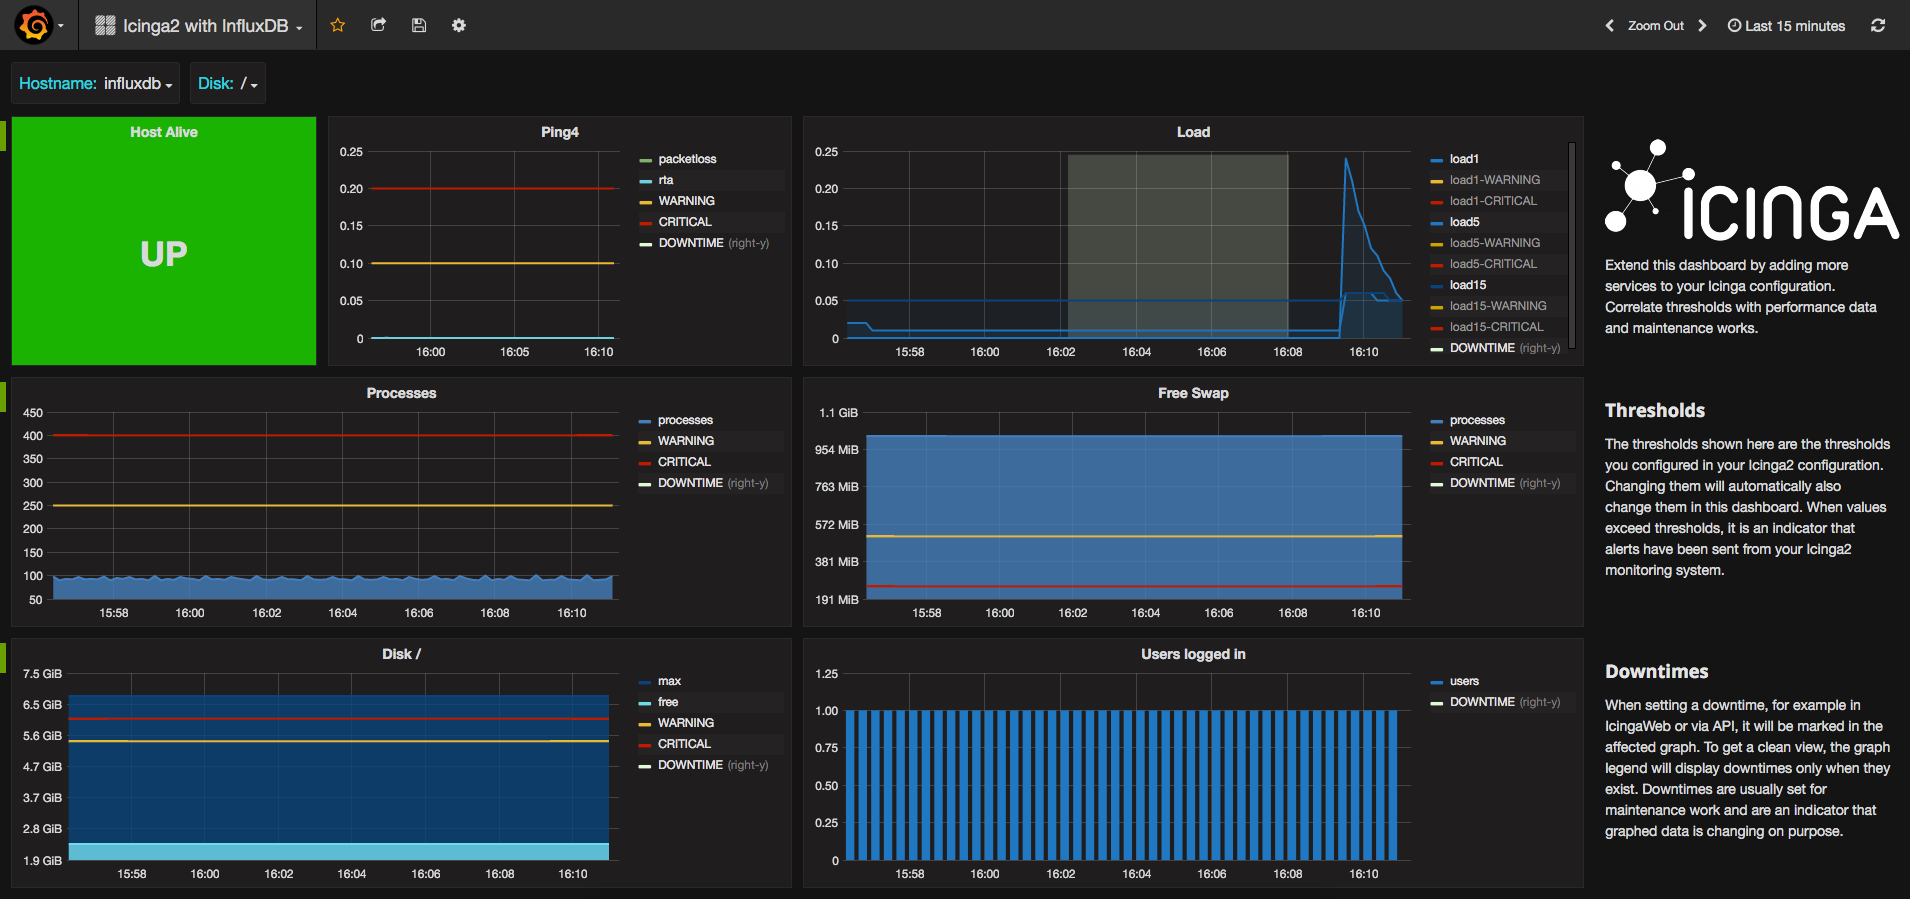
This dashboard can be used with a default icinga2 installation. It will show different states about a host and its services. Including UP/DOWN state, load, disk space, process count and more. The intention of the dashboard is to be extended as your icinga2 configuration grows. It includes special values like thresholds and downtimes.
Icinga2 InfluxDB Feature
To enable the InfluxdbWriter on your icinga2 installation, use the commandline:
icinga2 feature enable influxdb
Configure your InfluxDB host and database in /etc/icinga2/features-enabled/influxdb.conf:
object InfluxdbWriter "influxdb" {
  host = "127.0.0.1"
  port = 8086
  database = "icinga2"
  username = "icinga2"
  password = "icinga2"
  host_template = {
    measurement = "$host.check_command$"
    tags = {
      hostname = "$host.name$"
    }
  }
  service_template = {
    measurement = "$service.check_command$"
    tags = {
      hostname = "$host.name$"
      service = "$service.name$"
    }
  }
}
Learn more about the InfluxdbWriter in the Docs
Thresholds
Thresholds are not configured in graph panels, but retreived from icinga2. It helps you to find alerts that happened in the past. Sending of thresholds disabled by default, you need to enable it in your icinga2 influxdb.conf:
object InfluxdbWriter "influxdb" {
  [ ... ]
enable_send_thresholds = true
}
Metadata
Icinga2 can send metadata information about every host and service check. These data include information about downtimes, acknowledgements, states, execution time, latency and more. Sending metadata is disabled by default. To enable it, configure influxdb.conf:
object InfluxdbWriter "influxdb" {
  [ ... ]
enable_send_metadata = true
}
}
Data source config
Collector config:
Upload an updated version of an exported dashboard.json file from Grafana
| Revision | Description | Created | |
|---|---|---|---|
| Download |
InfluxDB
Easily monitor InfluxDB, an open source time series database, with Grafana Cloud's out-of-the-box monitoring solution.
Learn more
