Super Host Metrics
InfluxDB dashboards for telegraf metrics modified for variable datasource
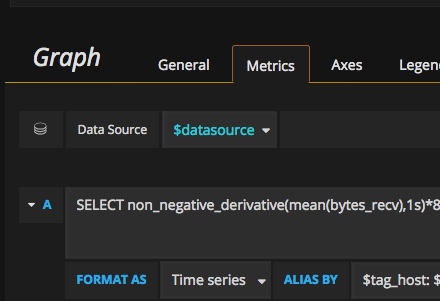
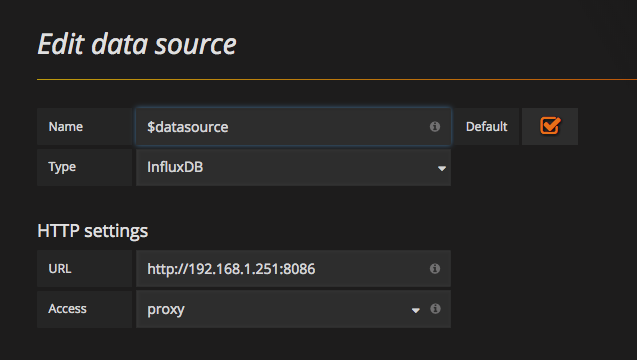
I modified this existing dashboard from here to use a variable name for the datasource because I want to be able to change the source for each panel & graph in one go, the built in import tool overrides with whatever you selected when importing, to workaround I created a datasource called $datasource, imported the dashboard then renamed the datasource, see the second screenshot.
Data source config
Collector config:
Upload an updated version of an exported dashboard.json file from Grafana
| Revision | Description | Created | |
|---|---|---|---|
| Download |


