Selenoid Stats
Browsers and resource usage for project https://github.com/aerokube/selenoid
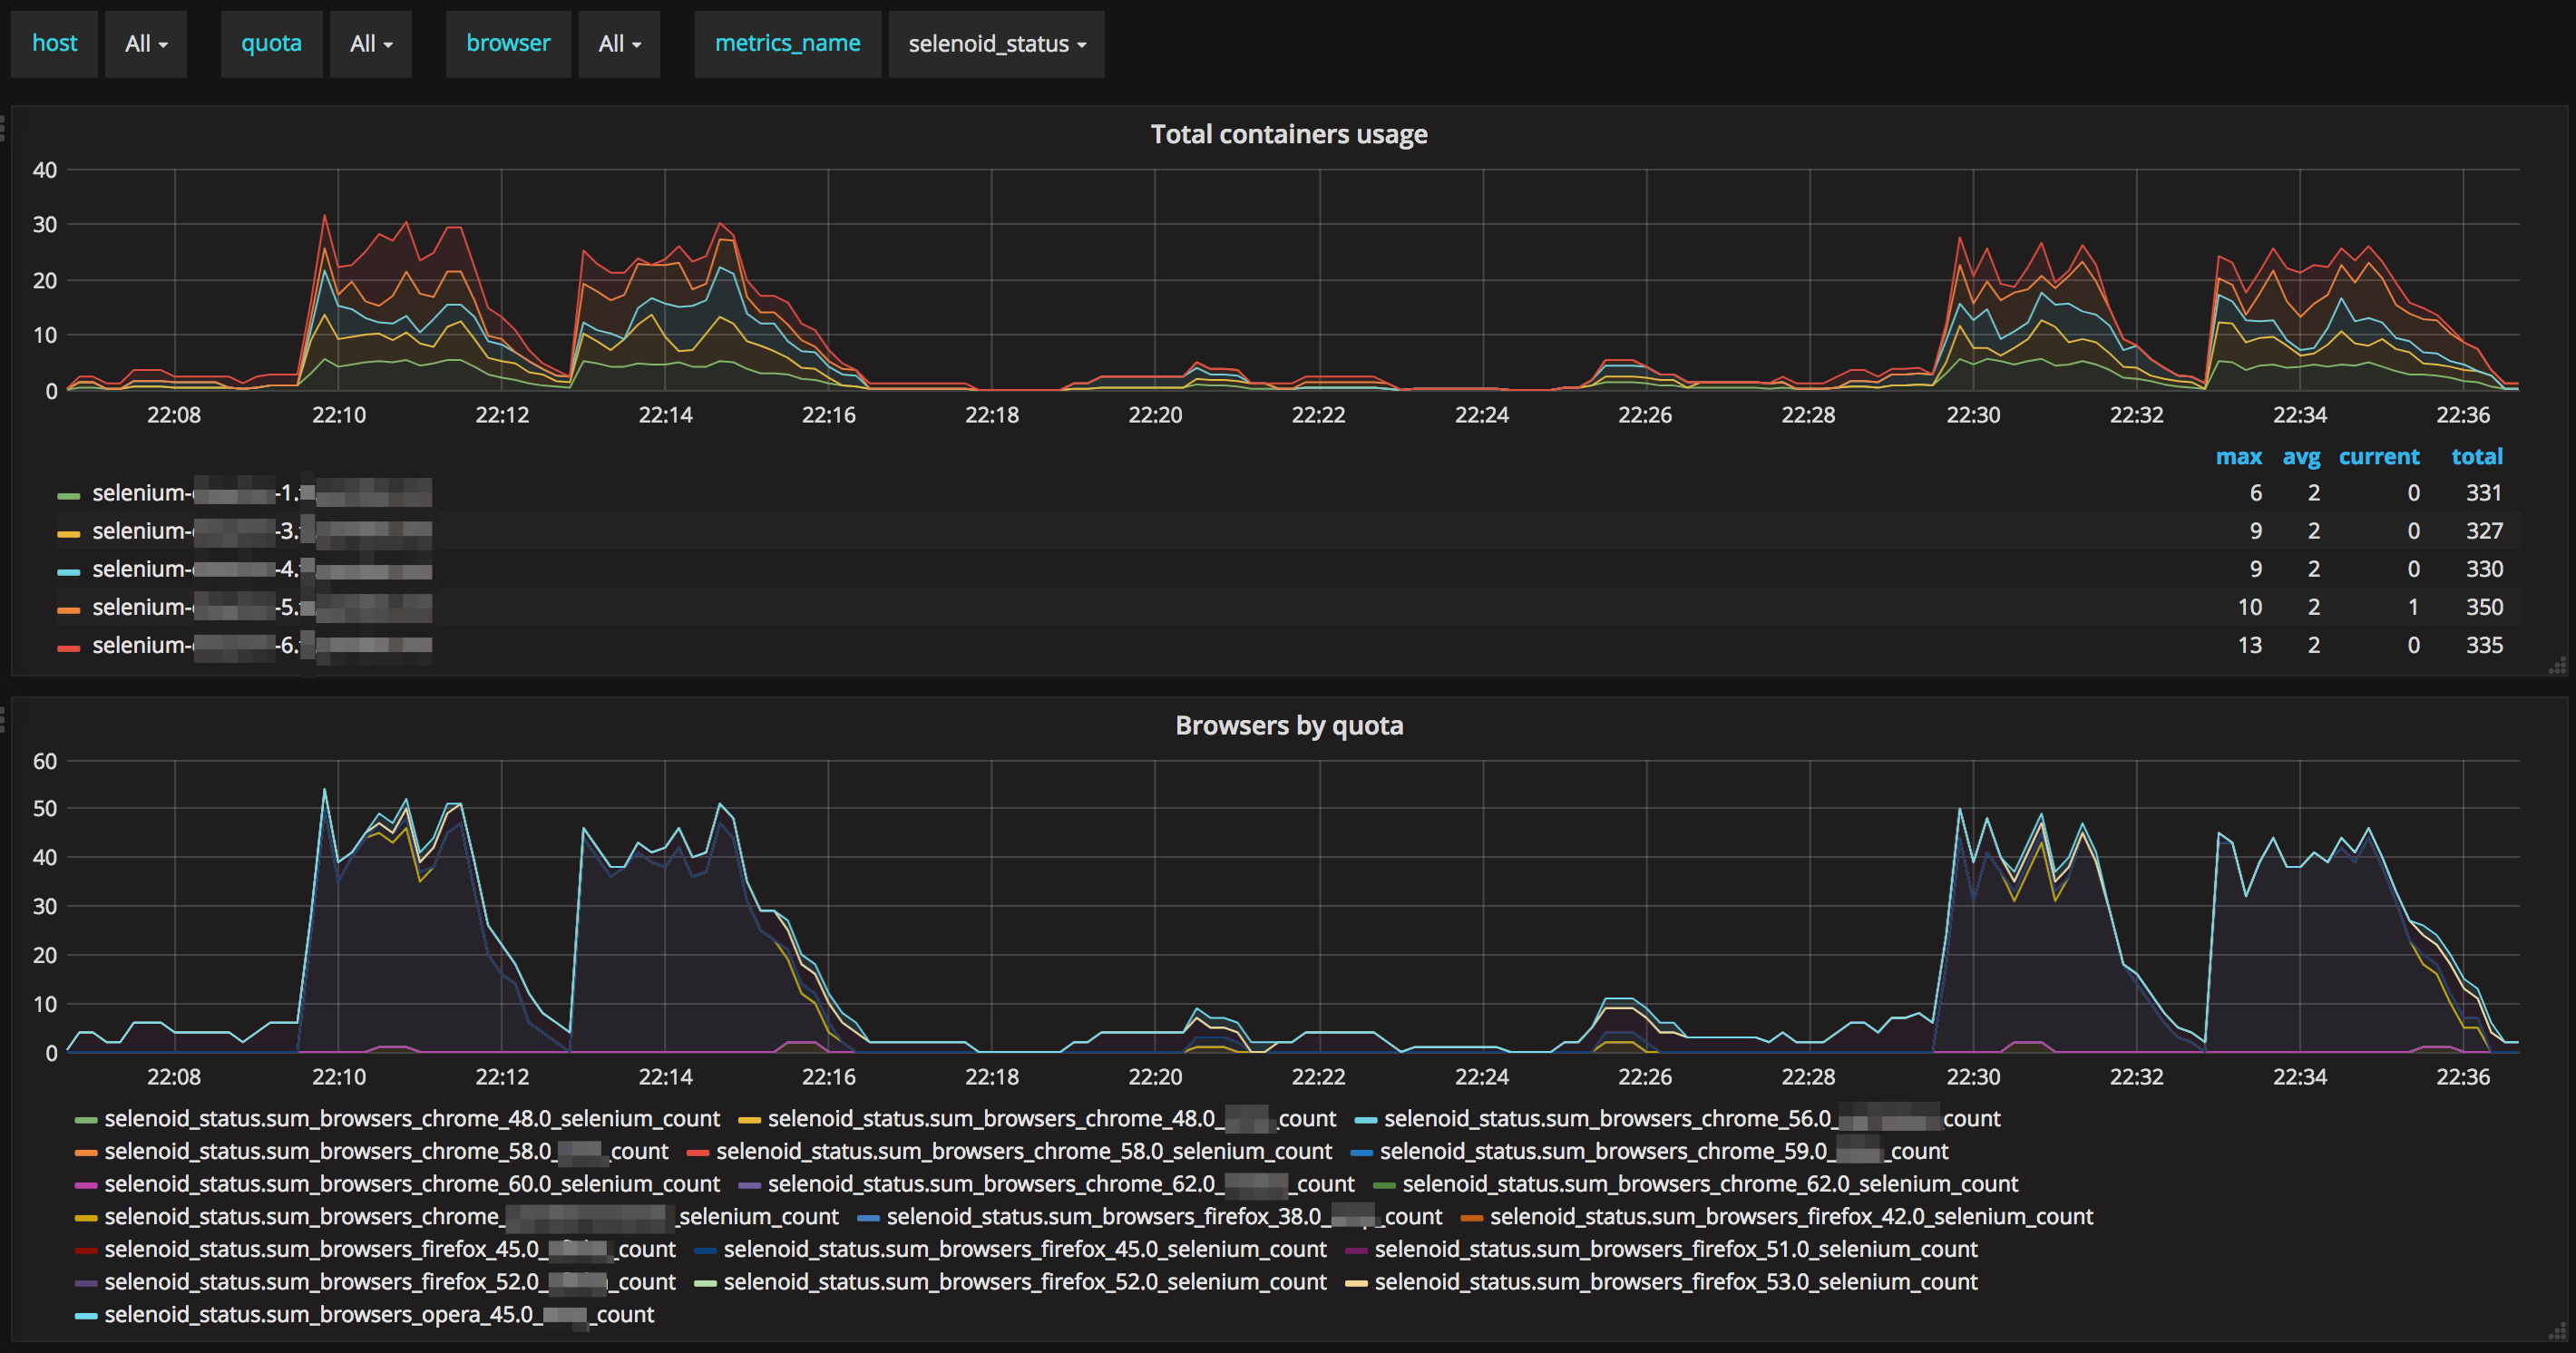
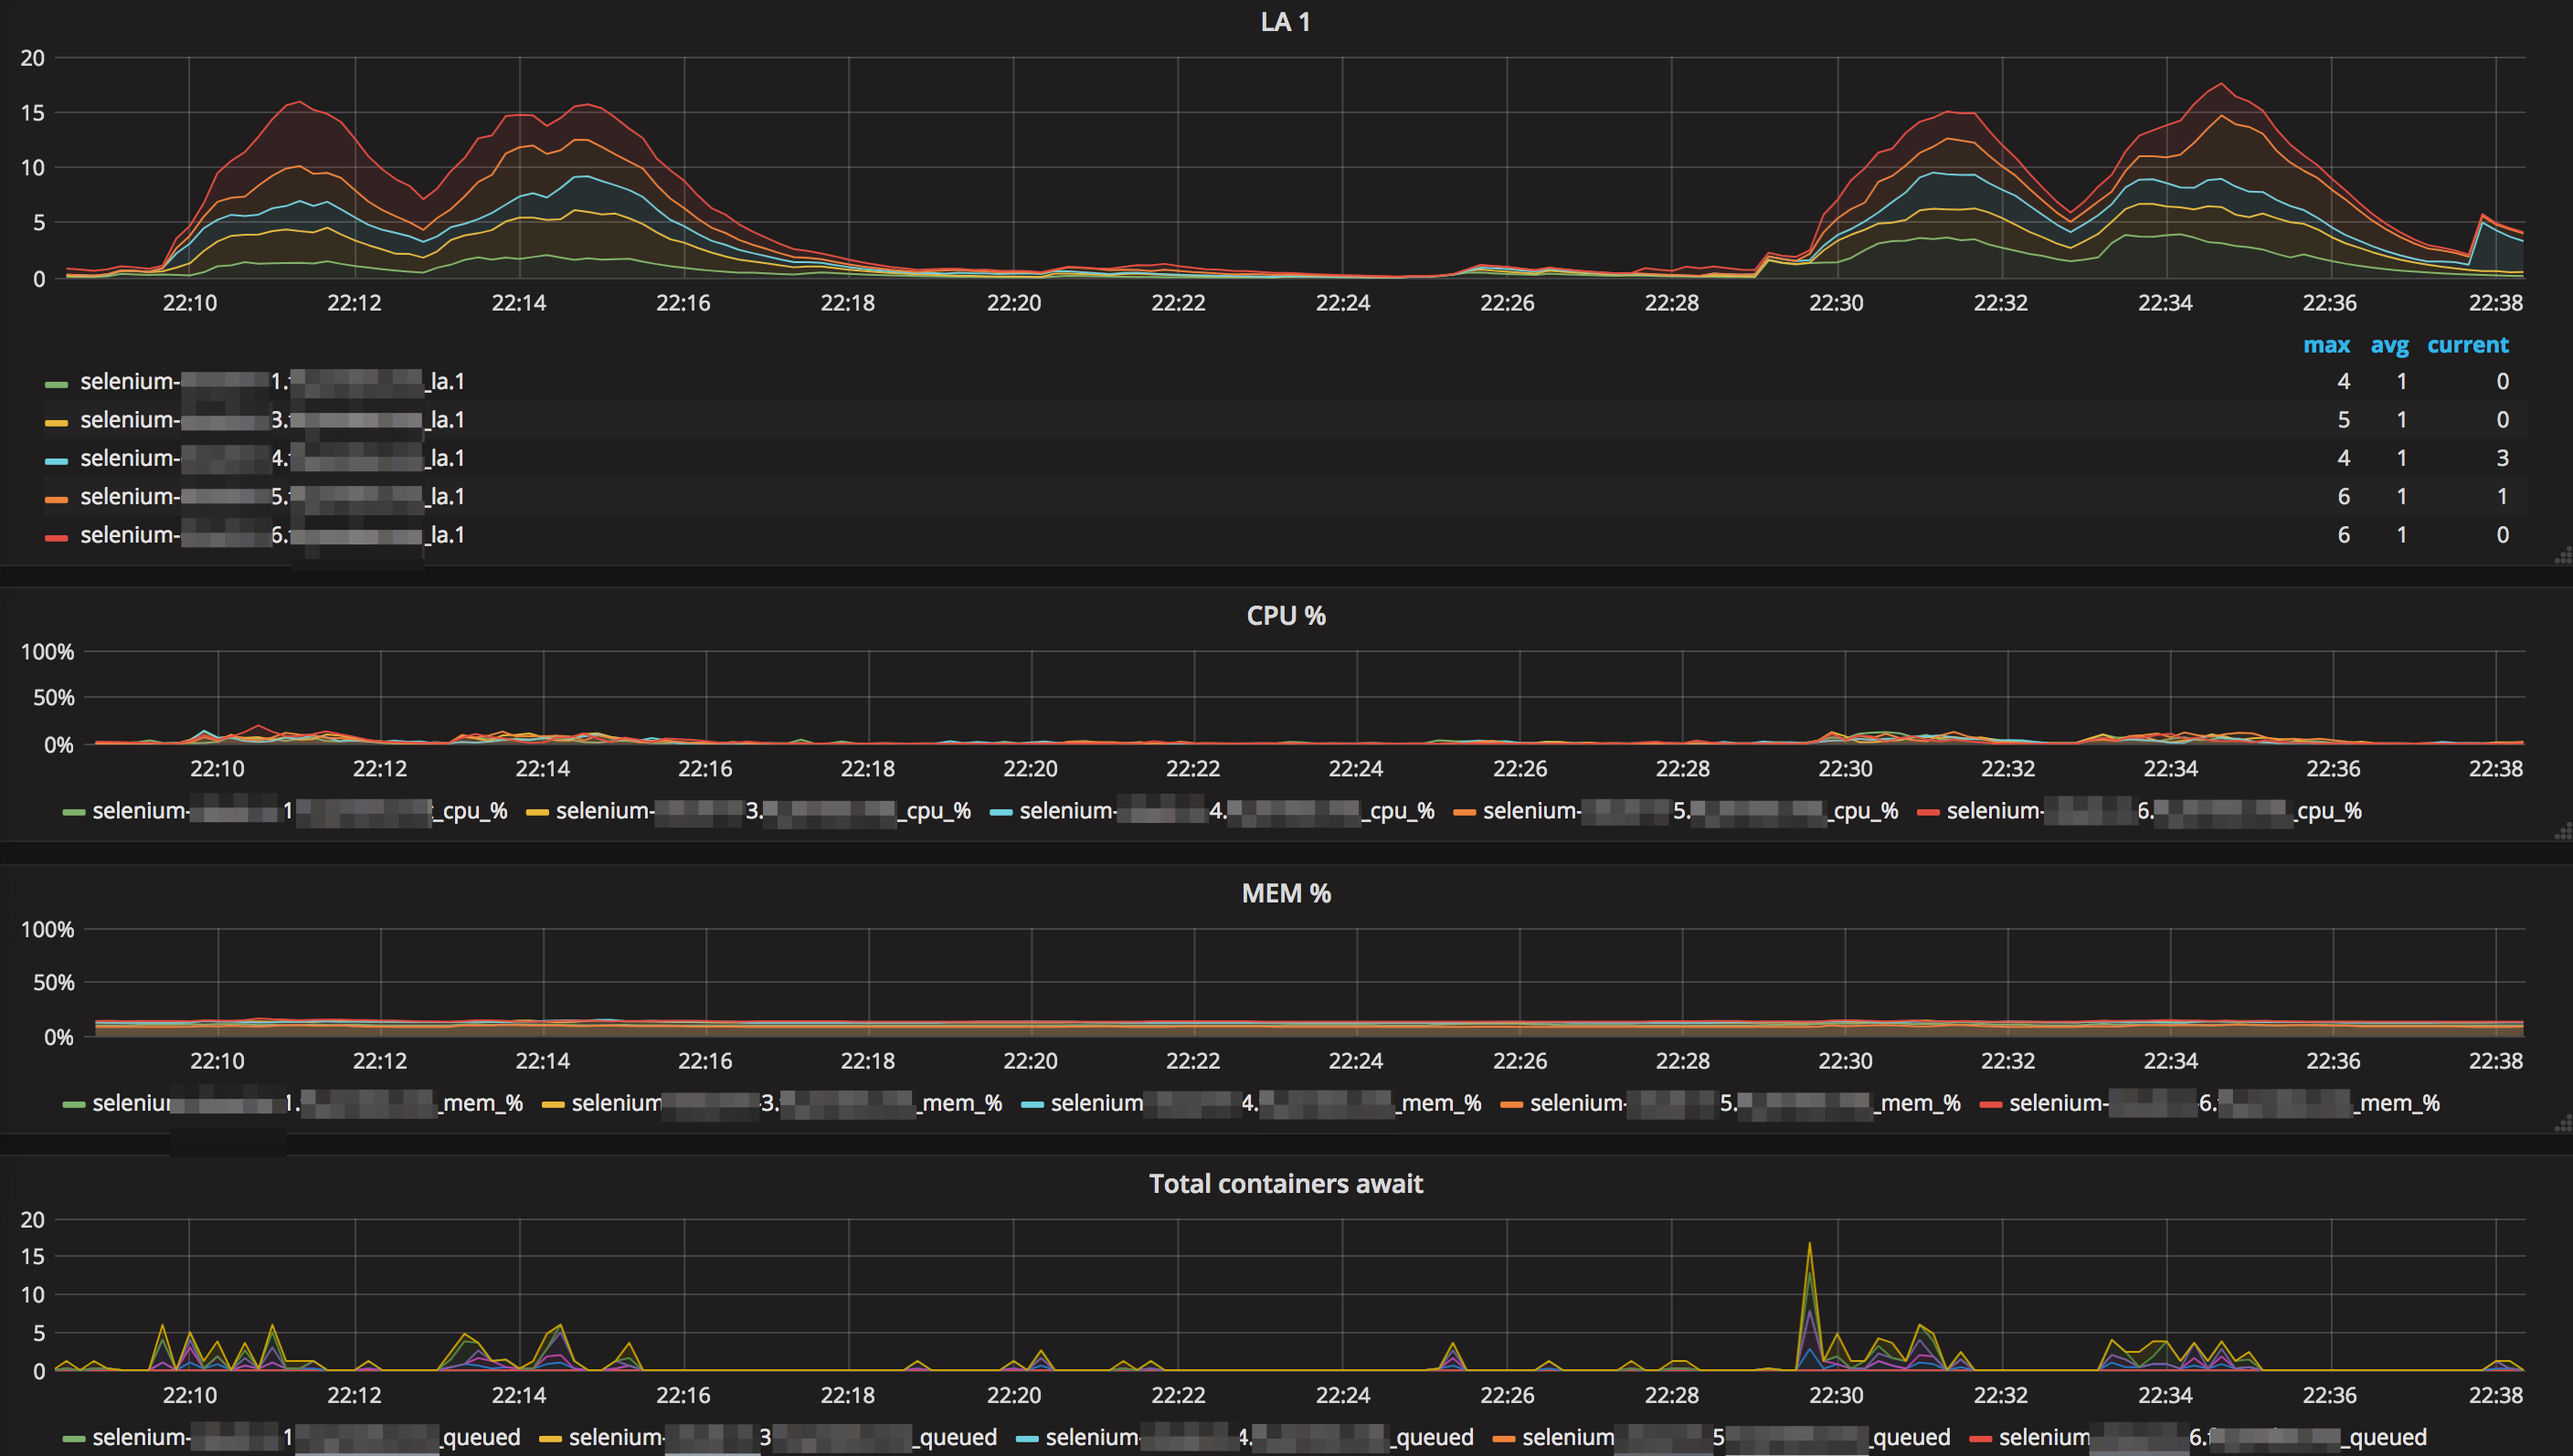
Example dashboard for Selenoid's Sending Statistics to External Systems help section, but with telegraf + influxdb pair.
Features
- Shows total usage of browsers on each host
- Can show usage of browsers in quota
- Can show browser usage in quotas
- Can match LA with active browsers
Requirements
You should install telegraf agent on each selenoid host to make possible system metrics collection.
Example
Example of ready-to-use telegraf+influxdb+grafana with docker-compose can be found at https://github.com/aerokube/selenoid-grafana-example
Data source config
Collector config:
Upload an updated version of an exported dashboard.json file from Grafana
| Revision | Description | Created | |
|---|---|---|---|
| Download |


