
JMeter Dashboard (3.2 and up)
Monitor your Jmeter load test in real time with InfluxDB and Grafana.
JMeter 3.2 introduced a new backend listener (InfluxdbBackendListernerClient) which is a huge step up from the original Graphite Backend Listener).
This dashboard was created for the InfluxdbBackendListernerClient, so it will work with JMeter 3.2 and up.
Steps:
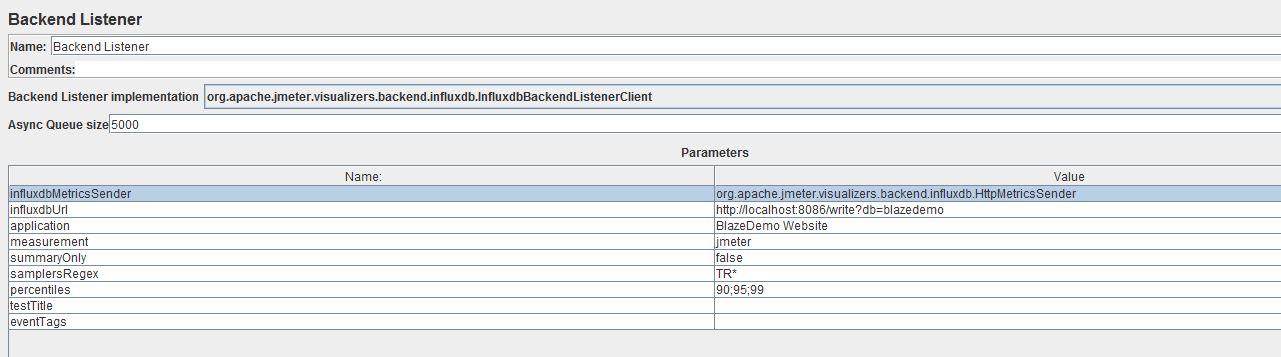
- Create your Test Plan and add the InfluxdbBackendListernerClient to the test plan.
- Configure the backend listener to write to your database
- Create your database in InfluxDB
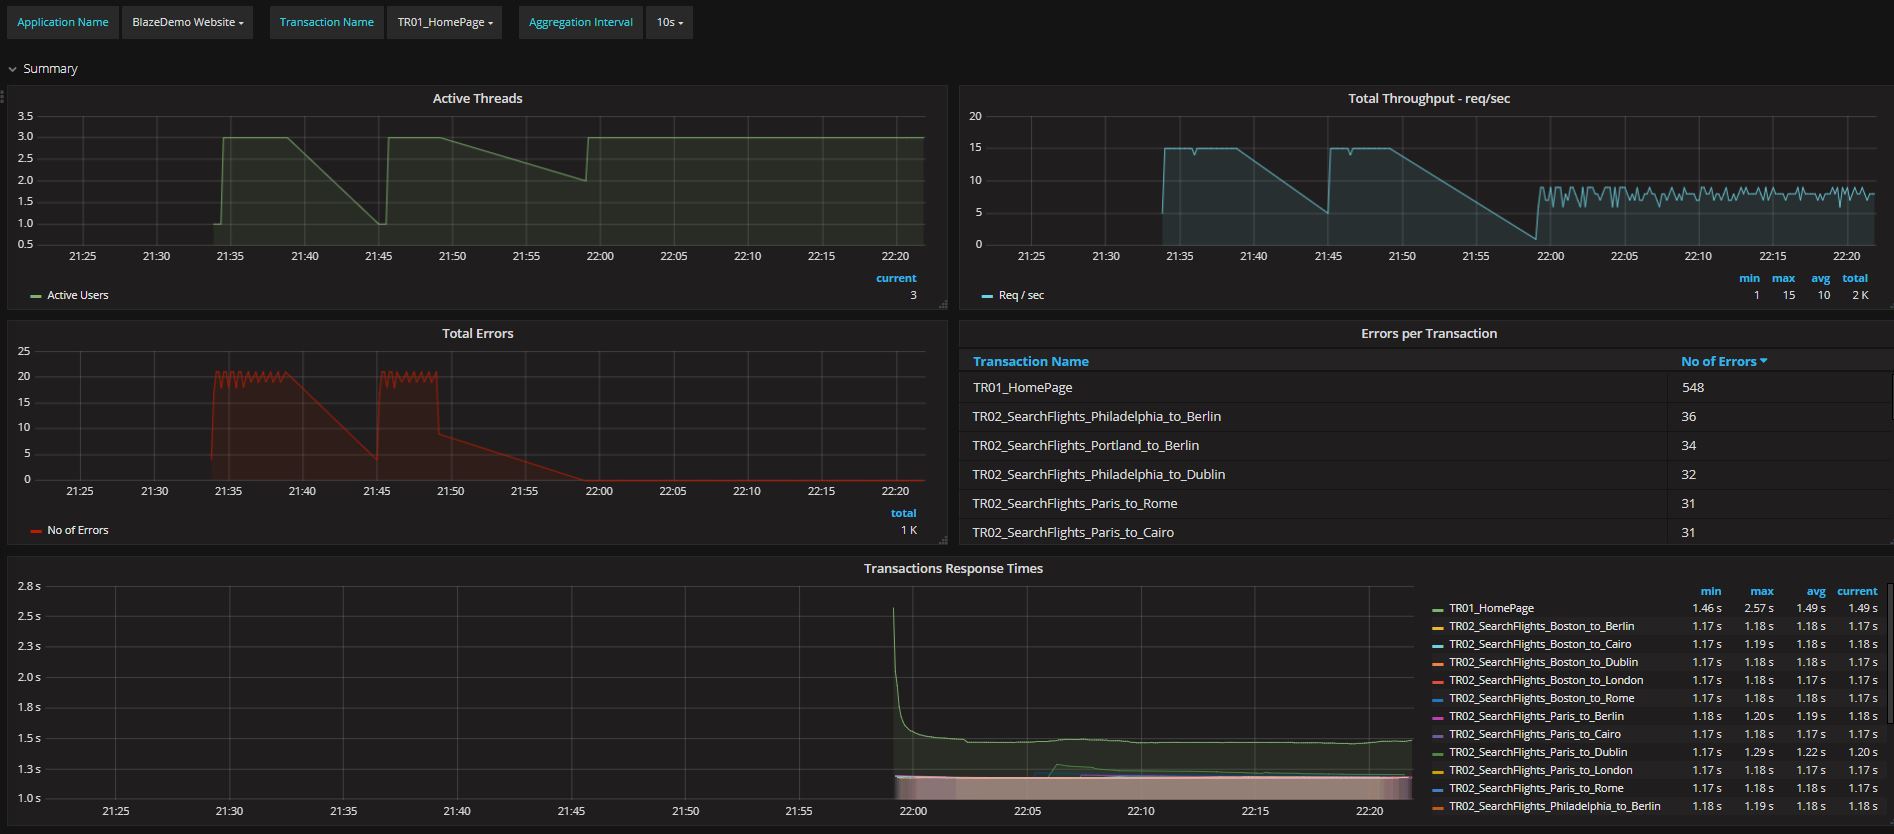
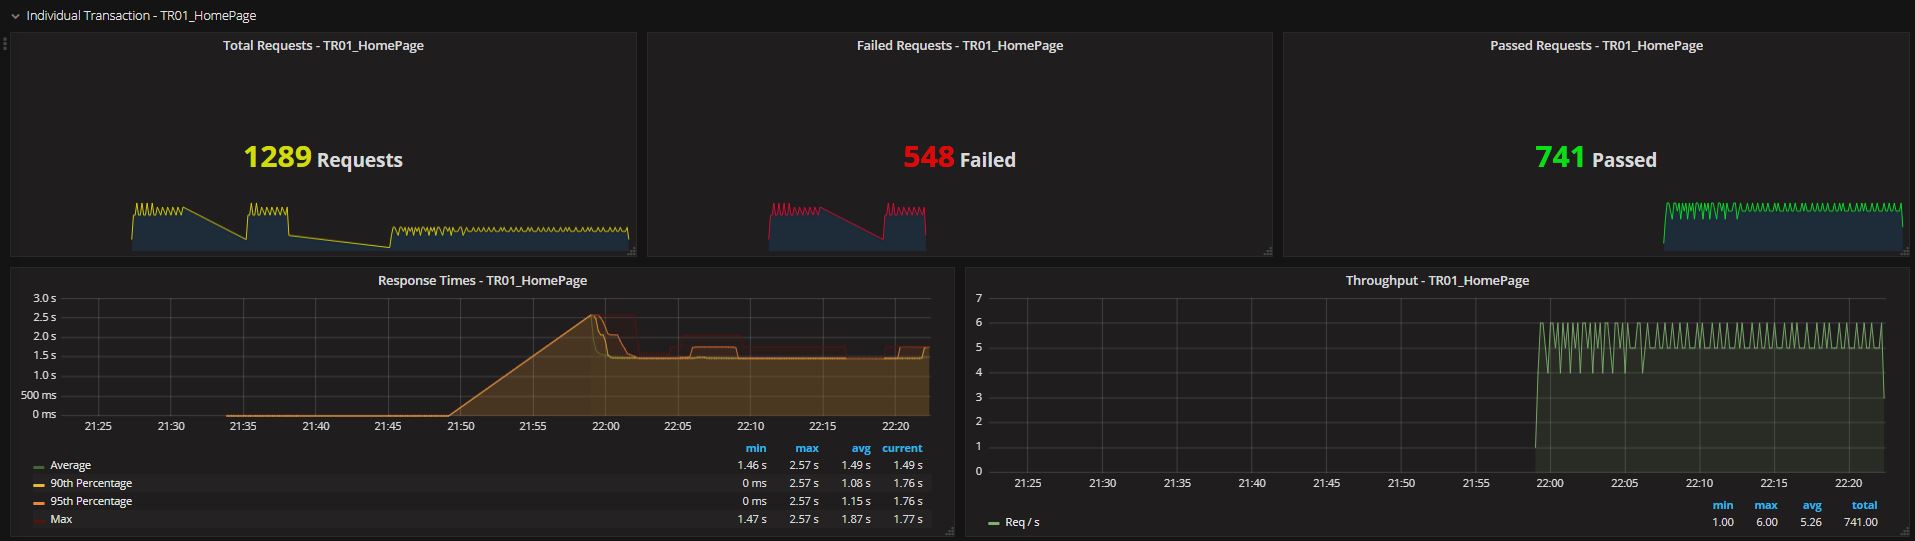
- Import this dashboard into Grafana
- Run the test.
Notes: you don’t need to edit anything in this dashboard. Your application and transactions will automatically be picked up.
Enjoy!
Data source config
Collector type:
Collector plugins:
Collector config:
Revisions
Upload an updated version of an exported dashboard.json file from Grafana
| Revision | Description | Created | |
|---|---|---|---|
| Download |