
Netdata dashboard
Netdata dashboard for all metrics
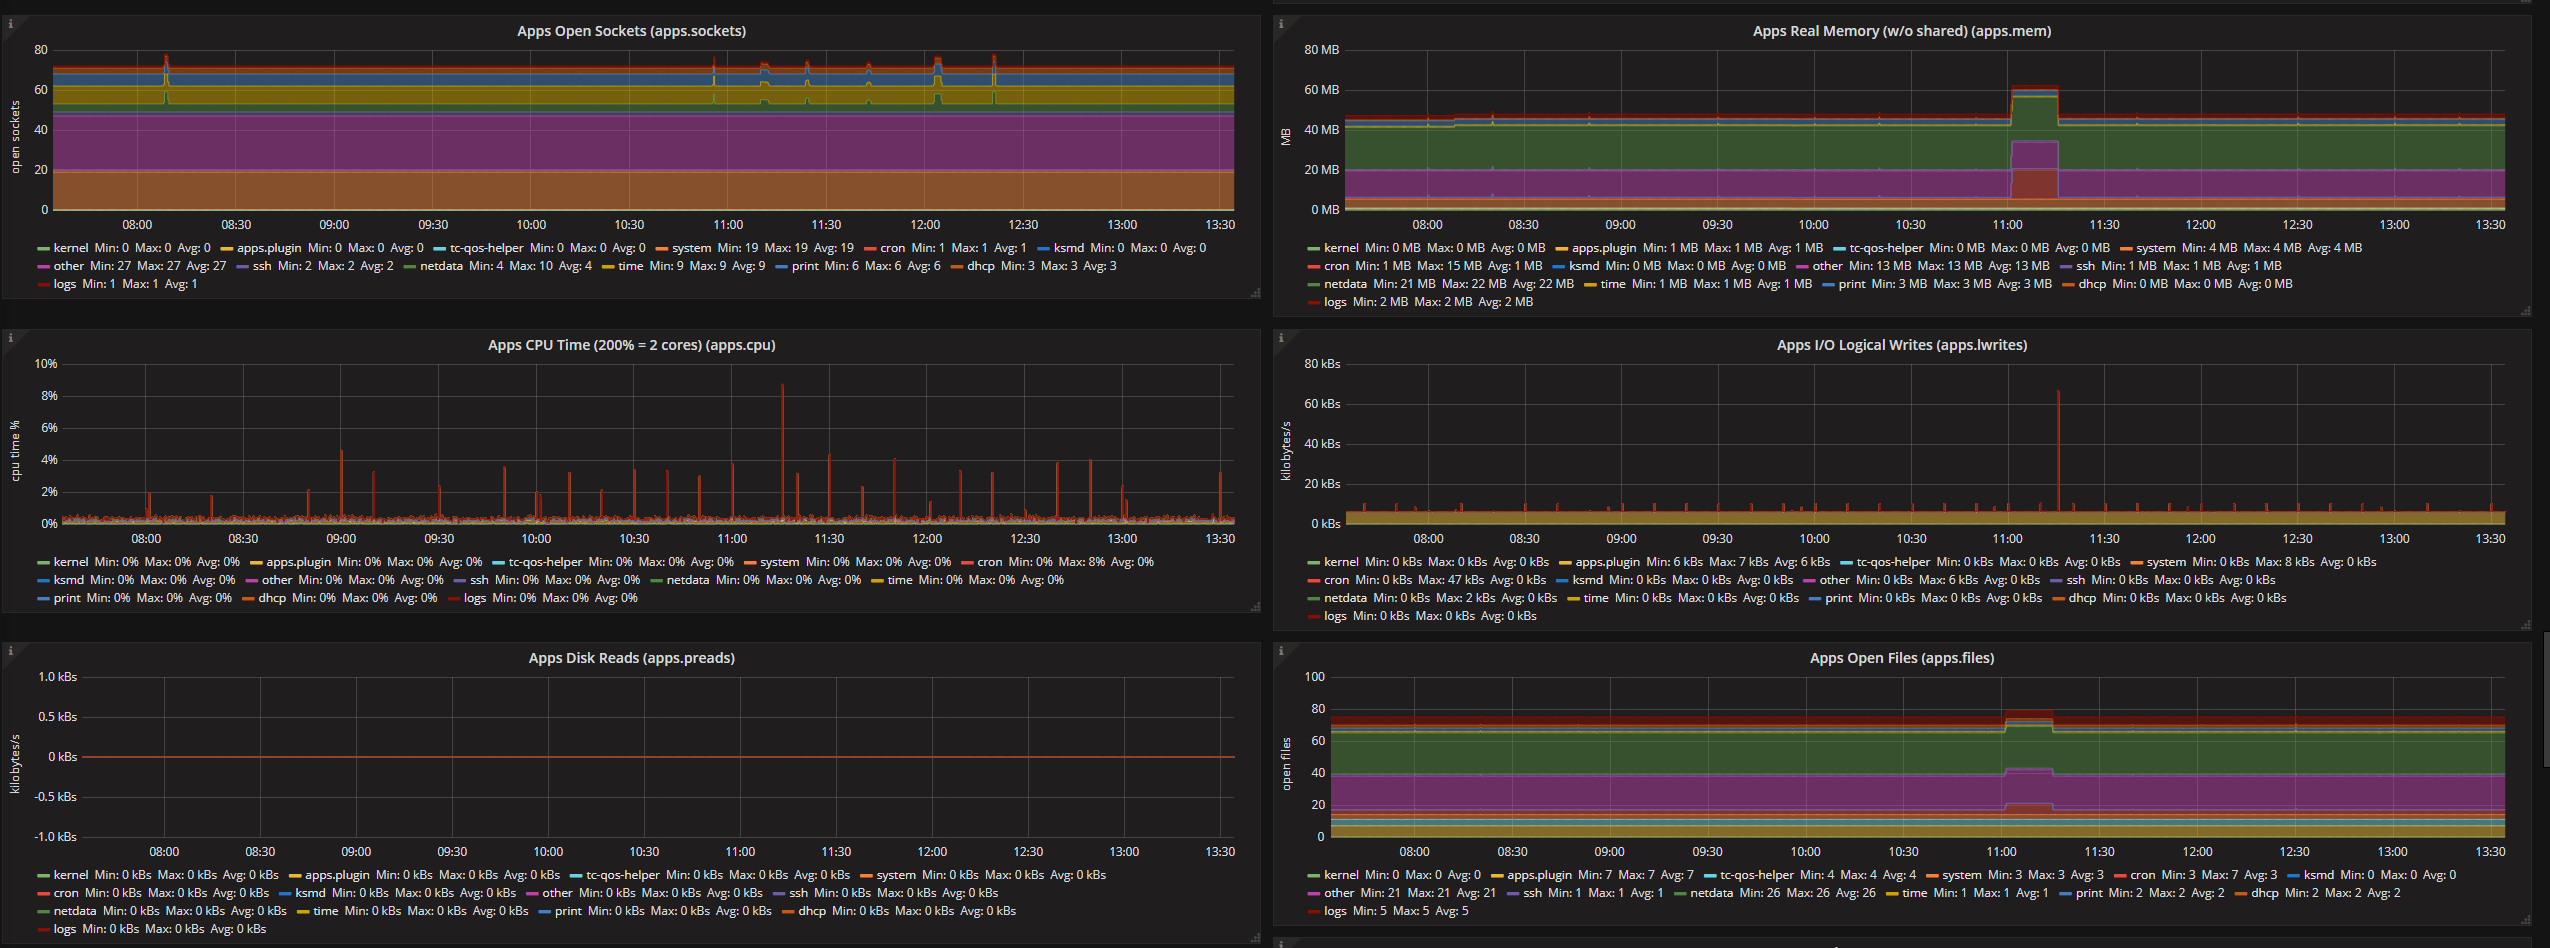
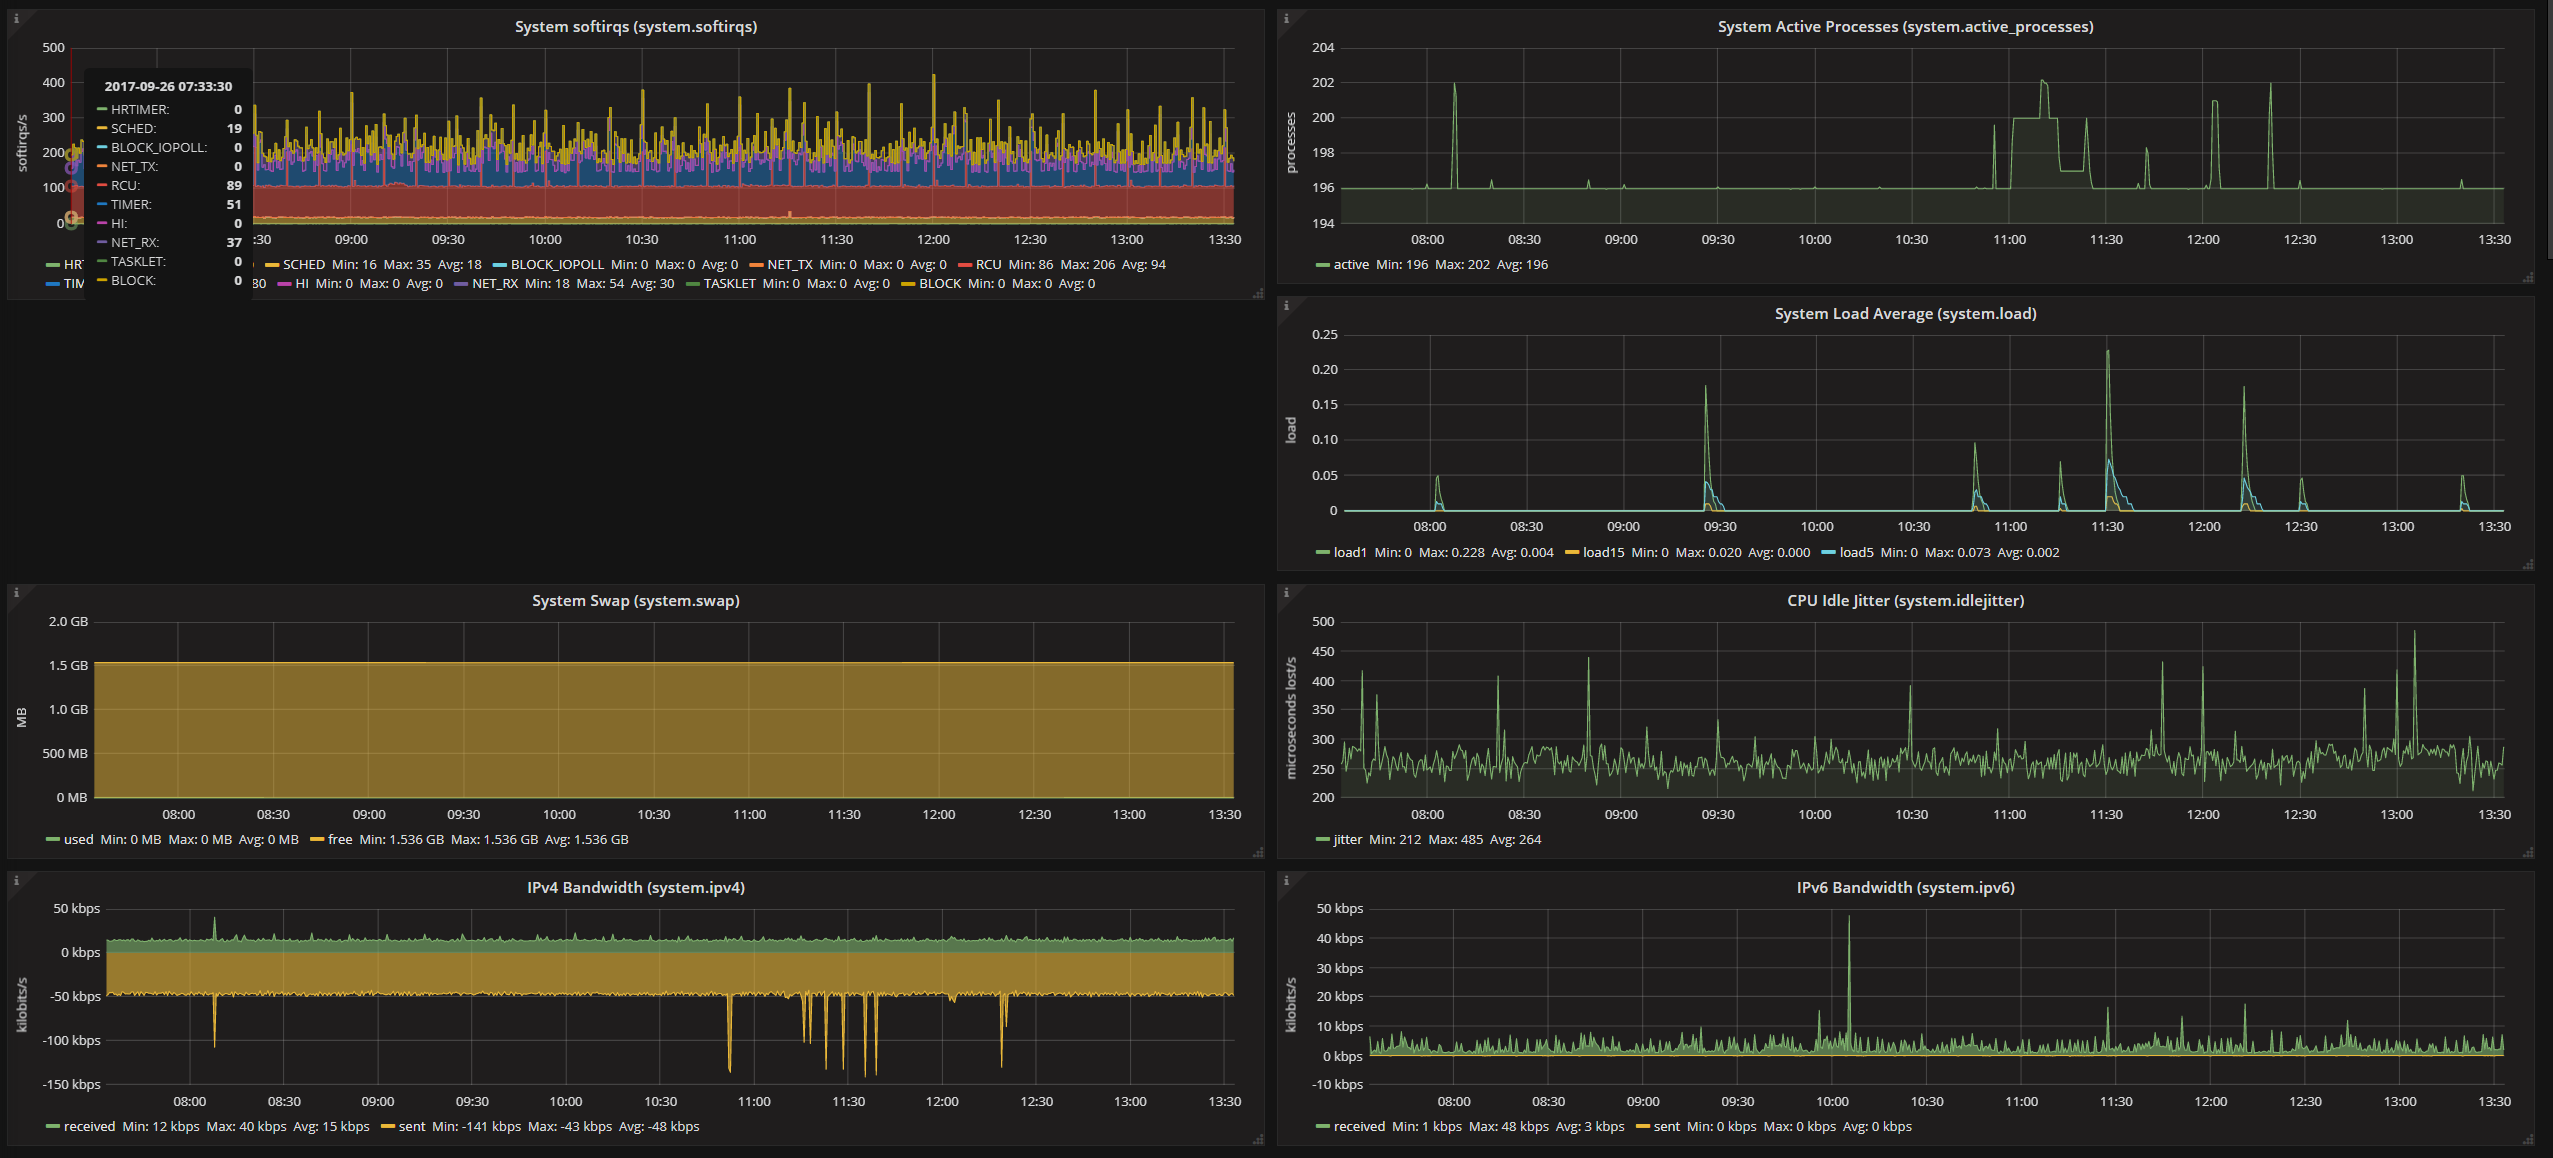
This dashboard is automatically generated from all netdata configuration parameters. You will need to change you metrics and prefixes or best option is to run this part of code https://github.com/juztas/netdata-grafana , which will prepare custom dashboard for your grafana from a host running netdata.
Data source config
Collector type:
Collector plugins:
Collector config:
Revisions
Upload an updated version of an exported dashboard.json file from Grafana
| Revision | Description | Created | |
|---|---|---|---|
| Download |