
Photon
Monitors Photon service and OpenSearch health, including Jetty threads and connections, JVM heap and non-heap memory, GC pauses and allocation, thread states and live threads, CPU usage, system load and open files, and OpenSearch shards, search rate and latency, index sizes, and cluster health.
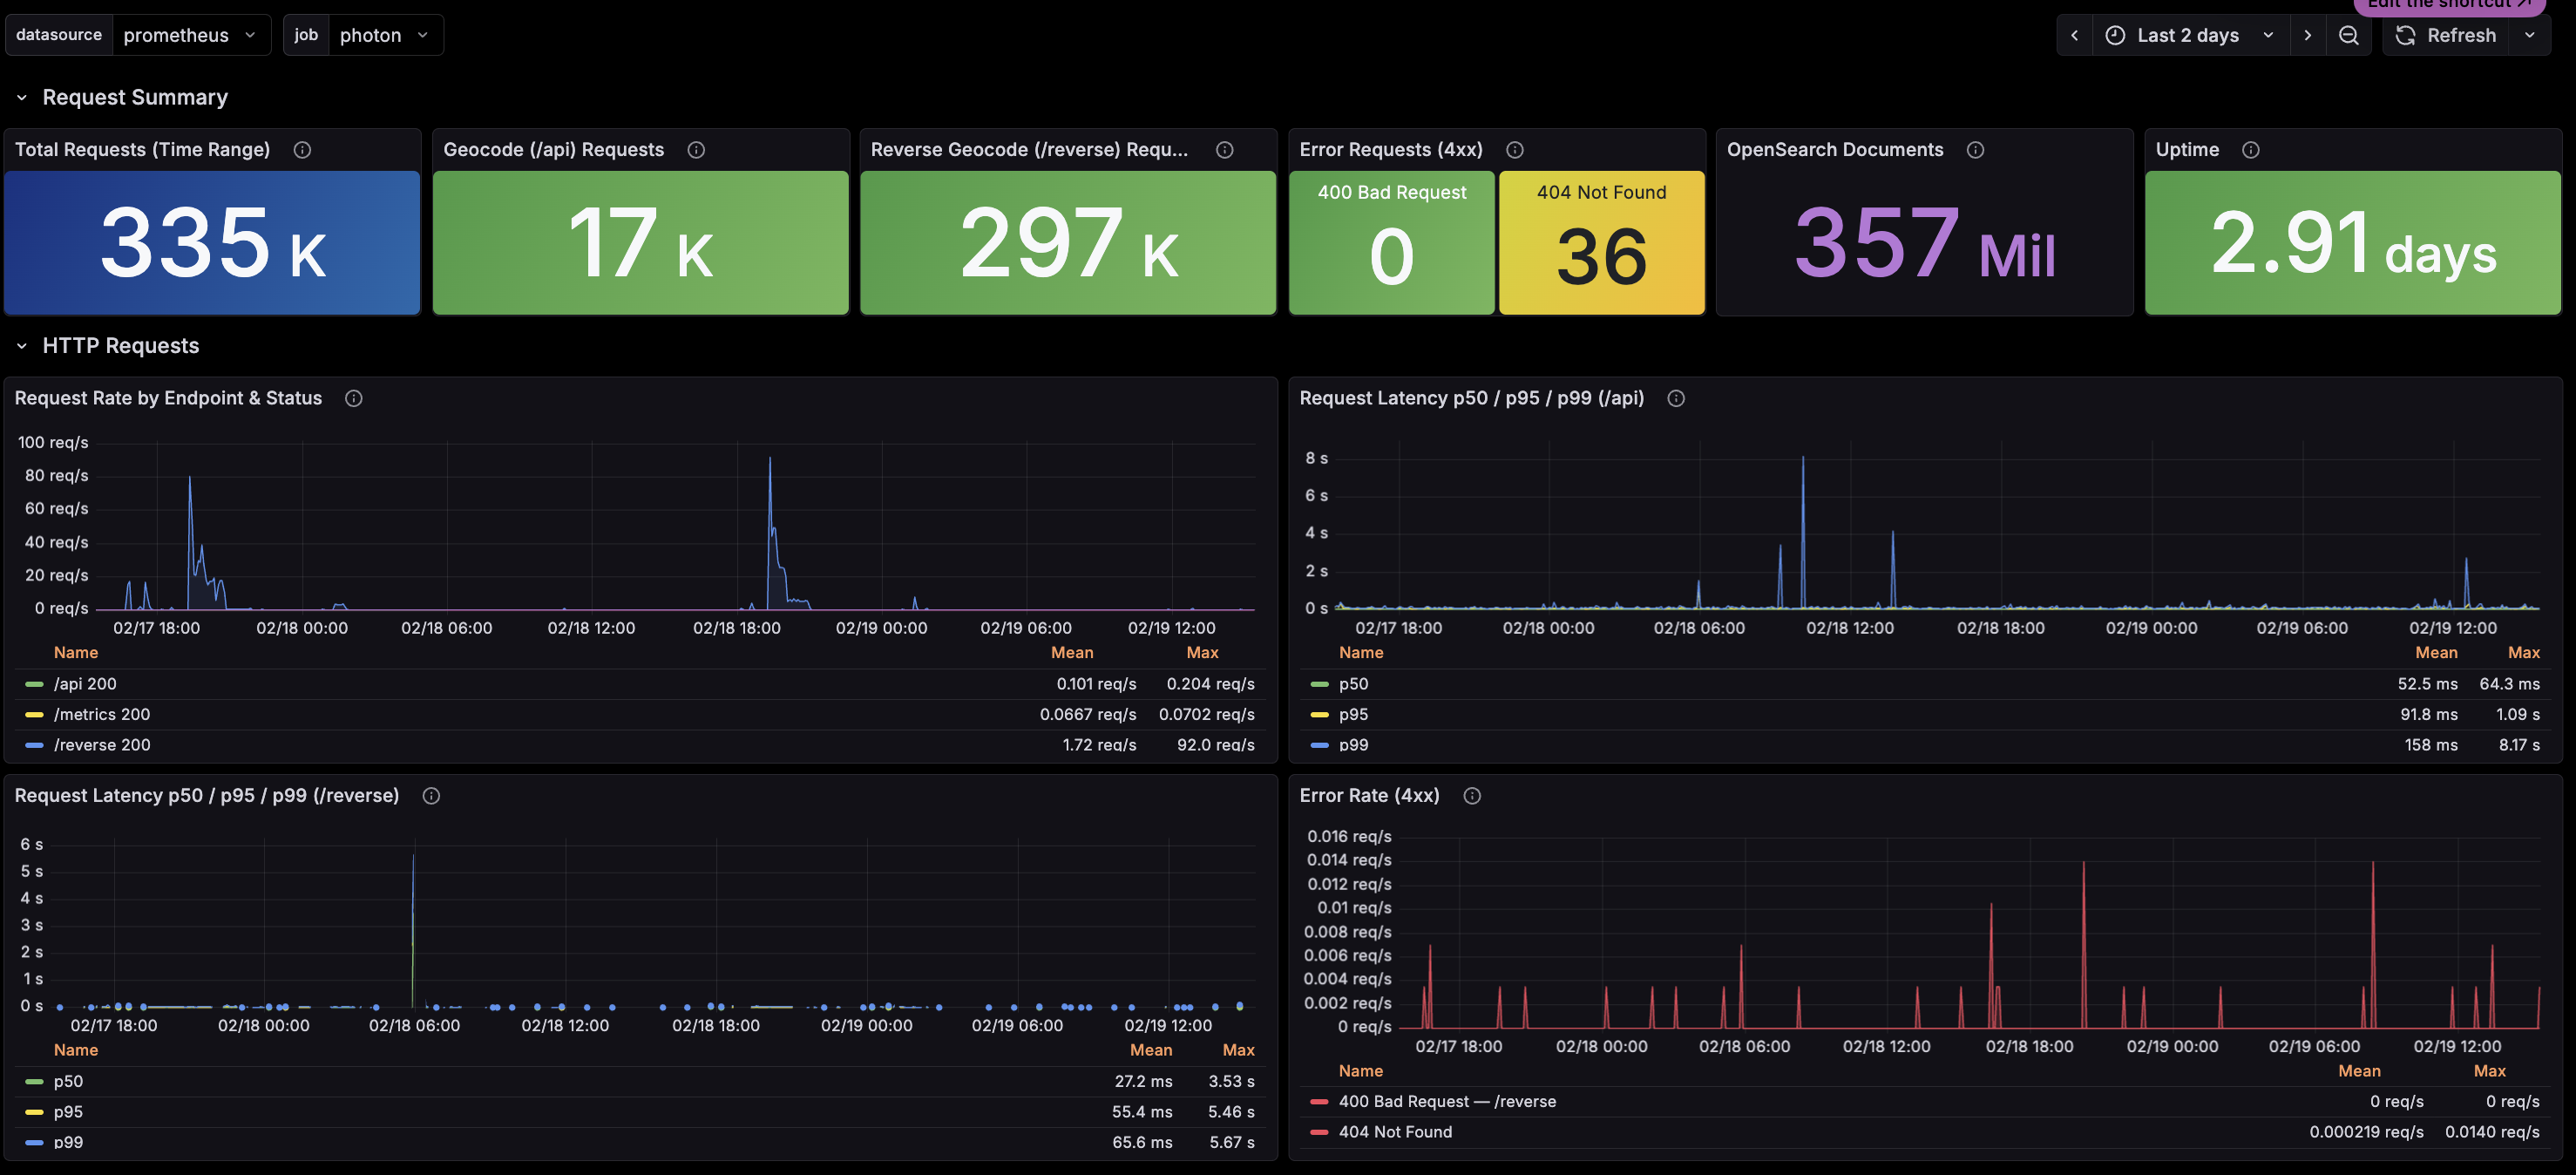
Uses prometheus metrics from komoot/photon.
Data source config
Collector type:
Collector plugins:
Collector config:
Revisions
Upload an updated version of an exported dashboard.json file from Grafana
| Revision | Description | Created | |
|---|---|---|---|
| Download |