
KrakenD AI Gateway
Official Grafana dashboard for KrakenD AI LLM metrics. Feeds from Prometheus using PromQL queries.
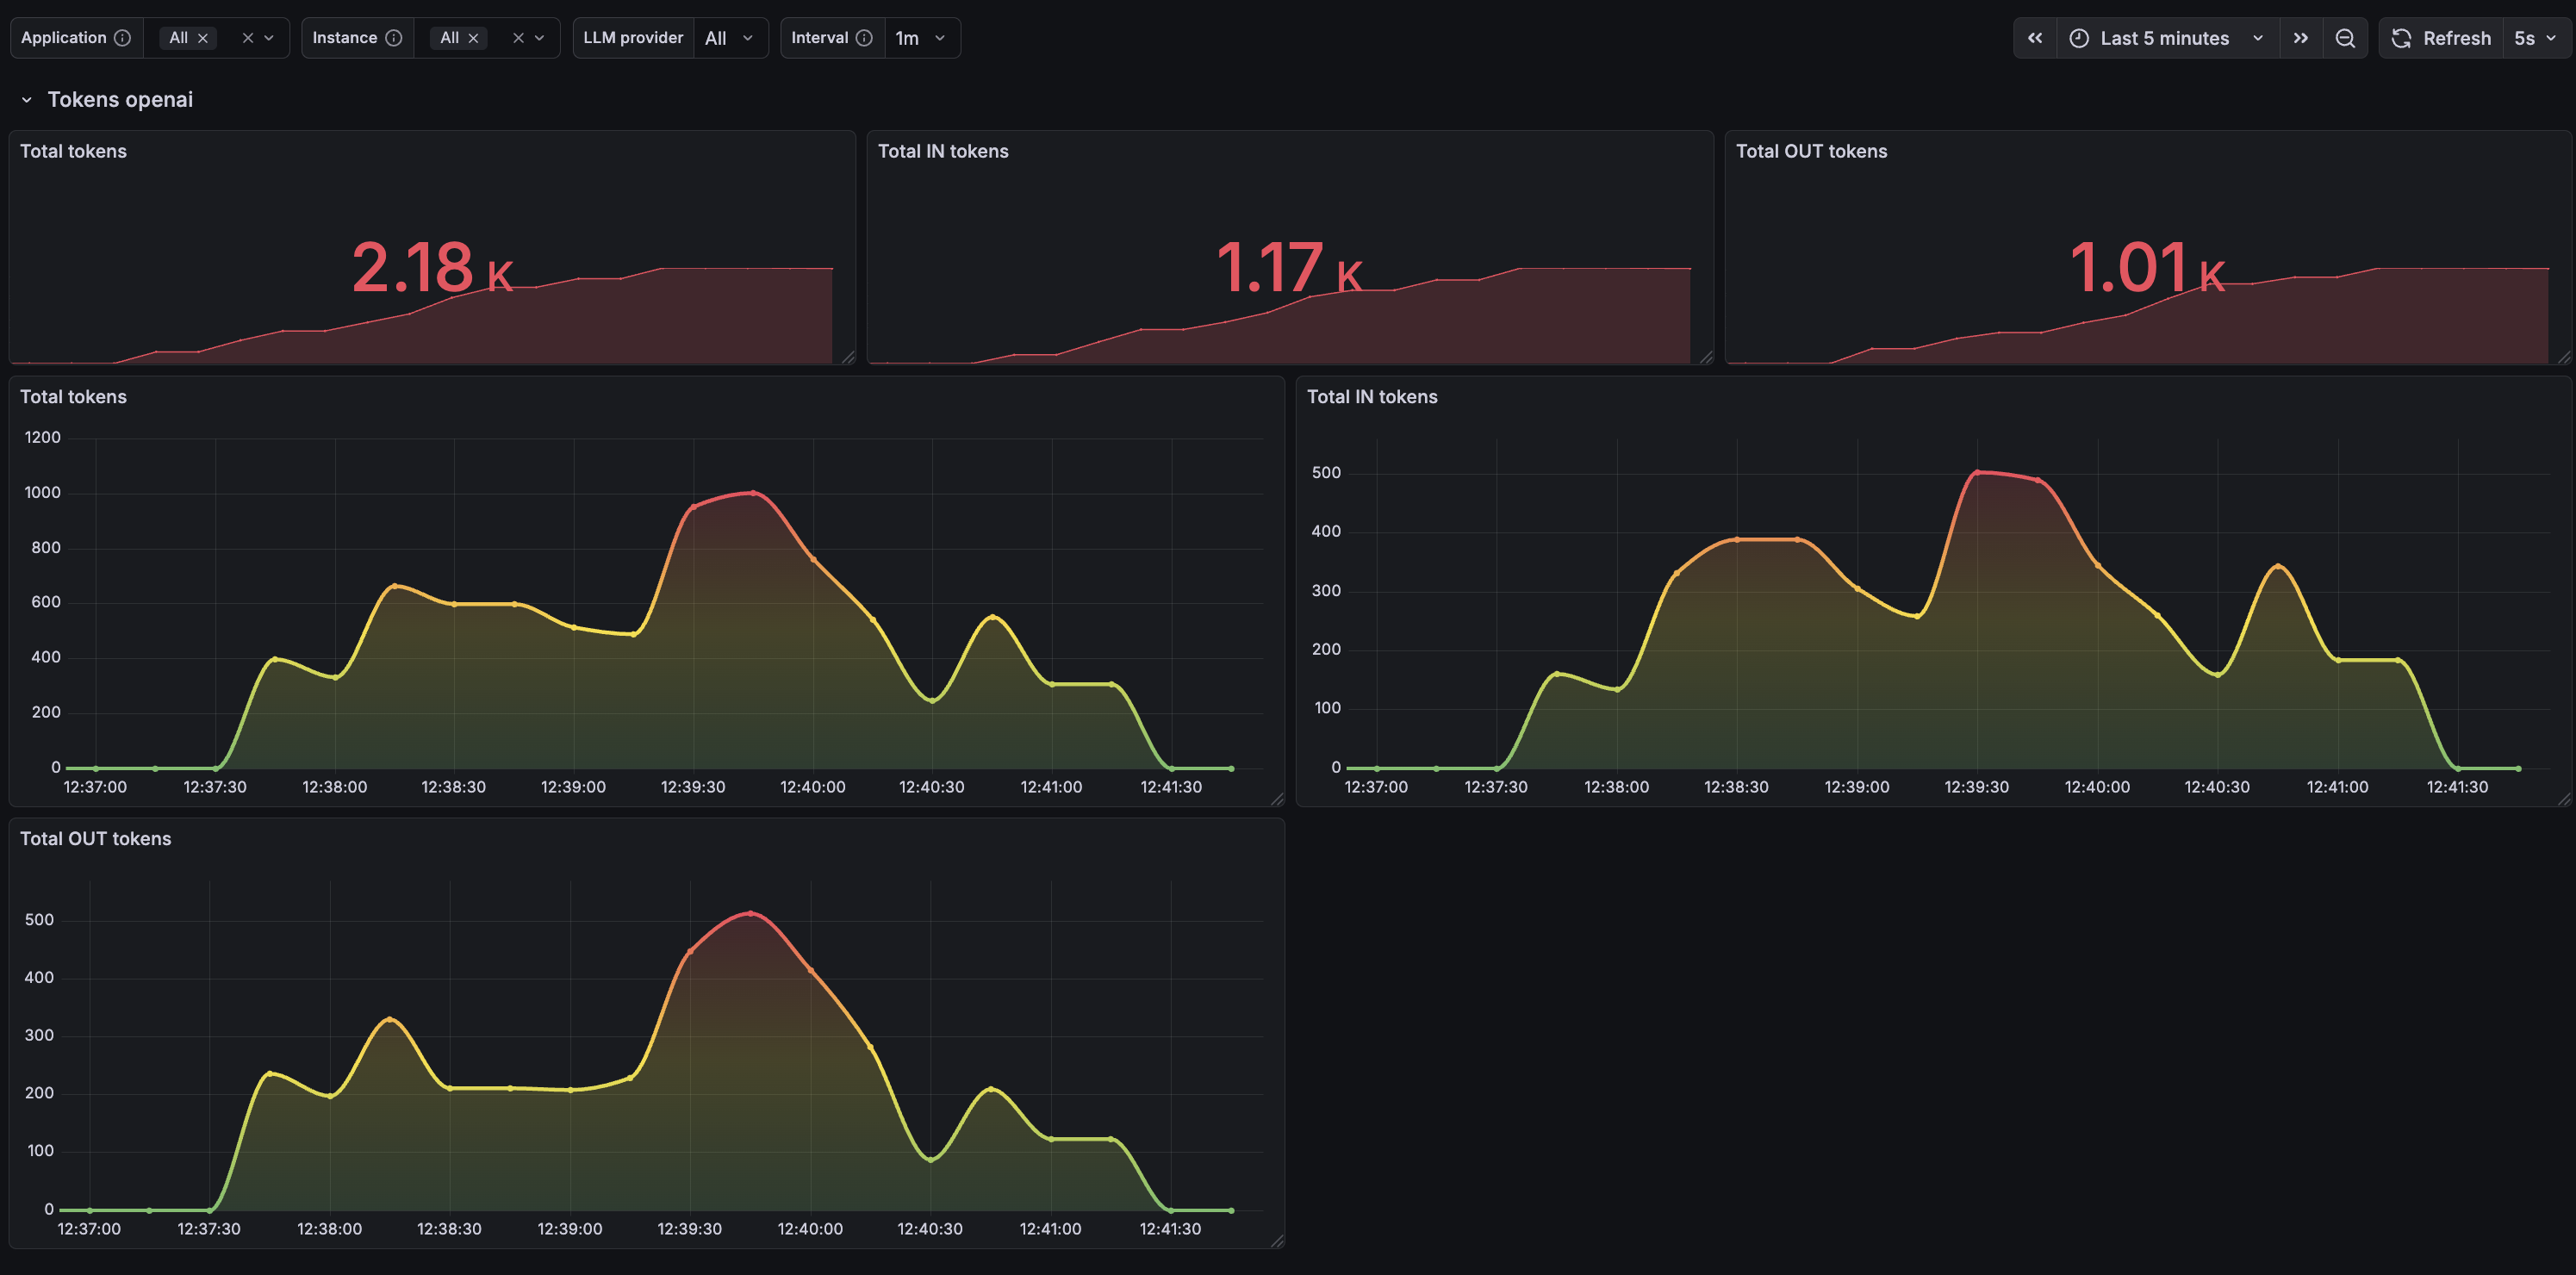
This dashboard feeds from a Prometheus datasource populated automatically by KrakenD ai/llm component metrics using the component telemetry/opentelemetry.
The dashboard is focused on AI and LLM usage and offers you per AI provider metrics like: total token usage, input tokens and output tokens.
Data source config
Collector type:
Collector plugins:
Collector config:
Revisions
Upload an updated version of an exported dashboard.json file from Grafana
| Revision | Description | Created | |
|---|---|---|---|
| Download |