
rstmdb Monitoring
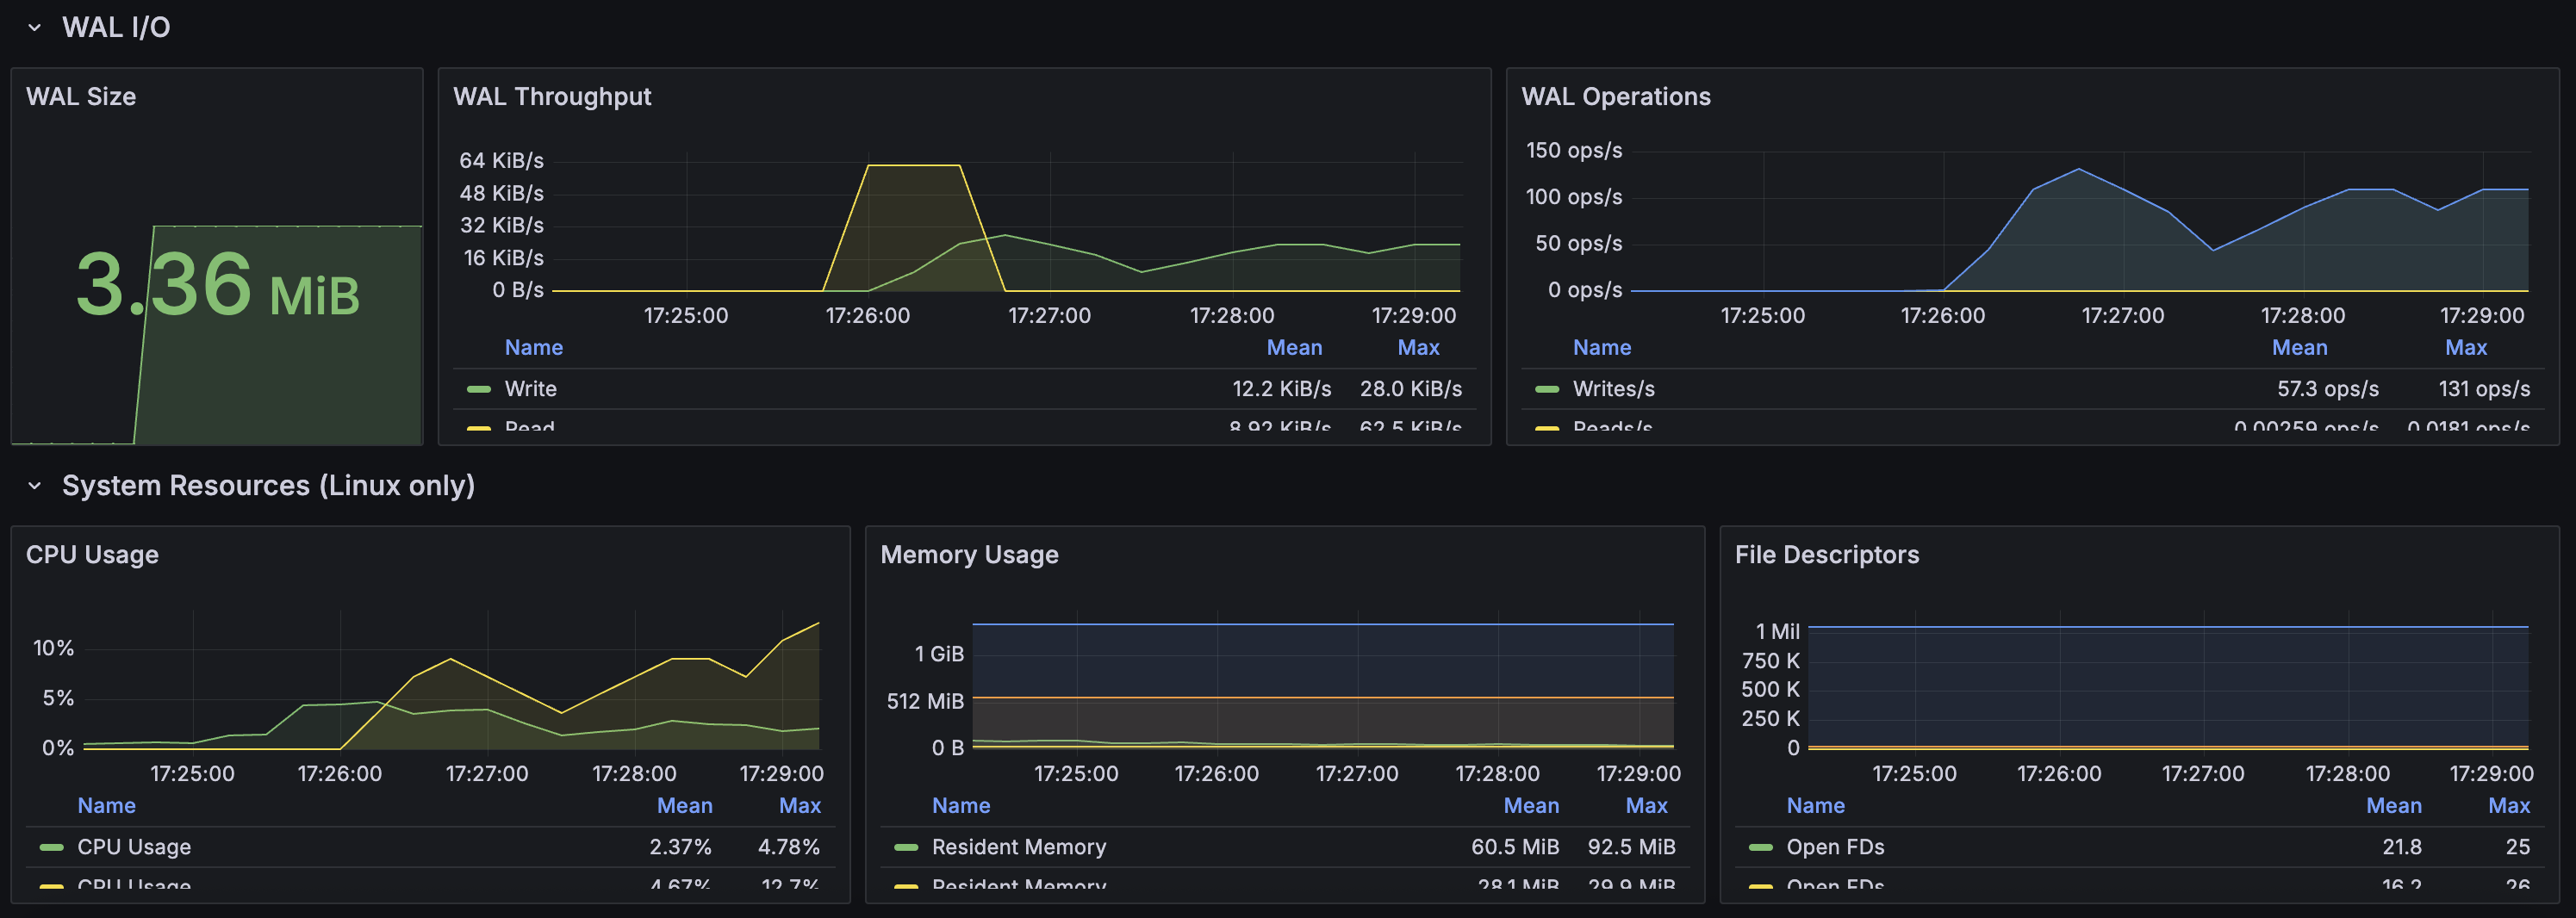
Comprehensive monitoring dashboard for rstmdb - a distributed state machine database. Includes request metrics, latency percentiles, error rates, WAL I/O, and system resources.
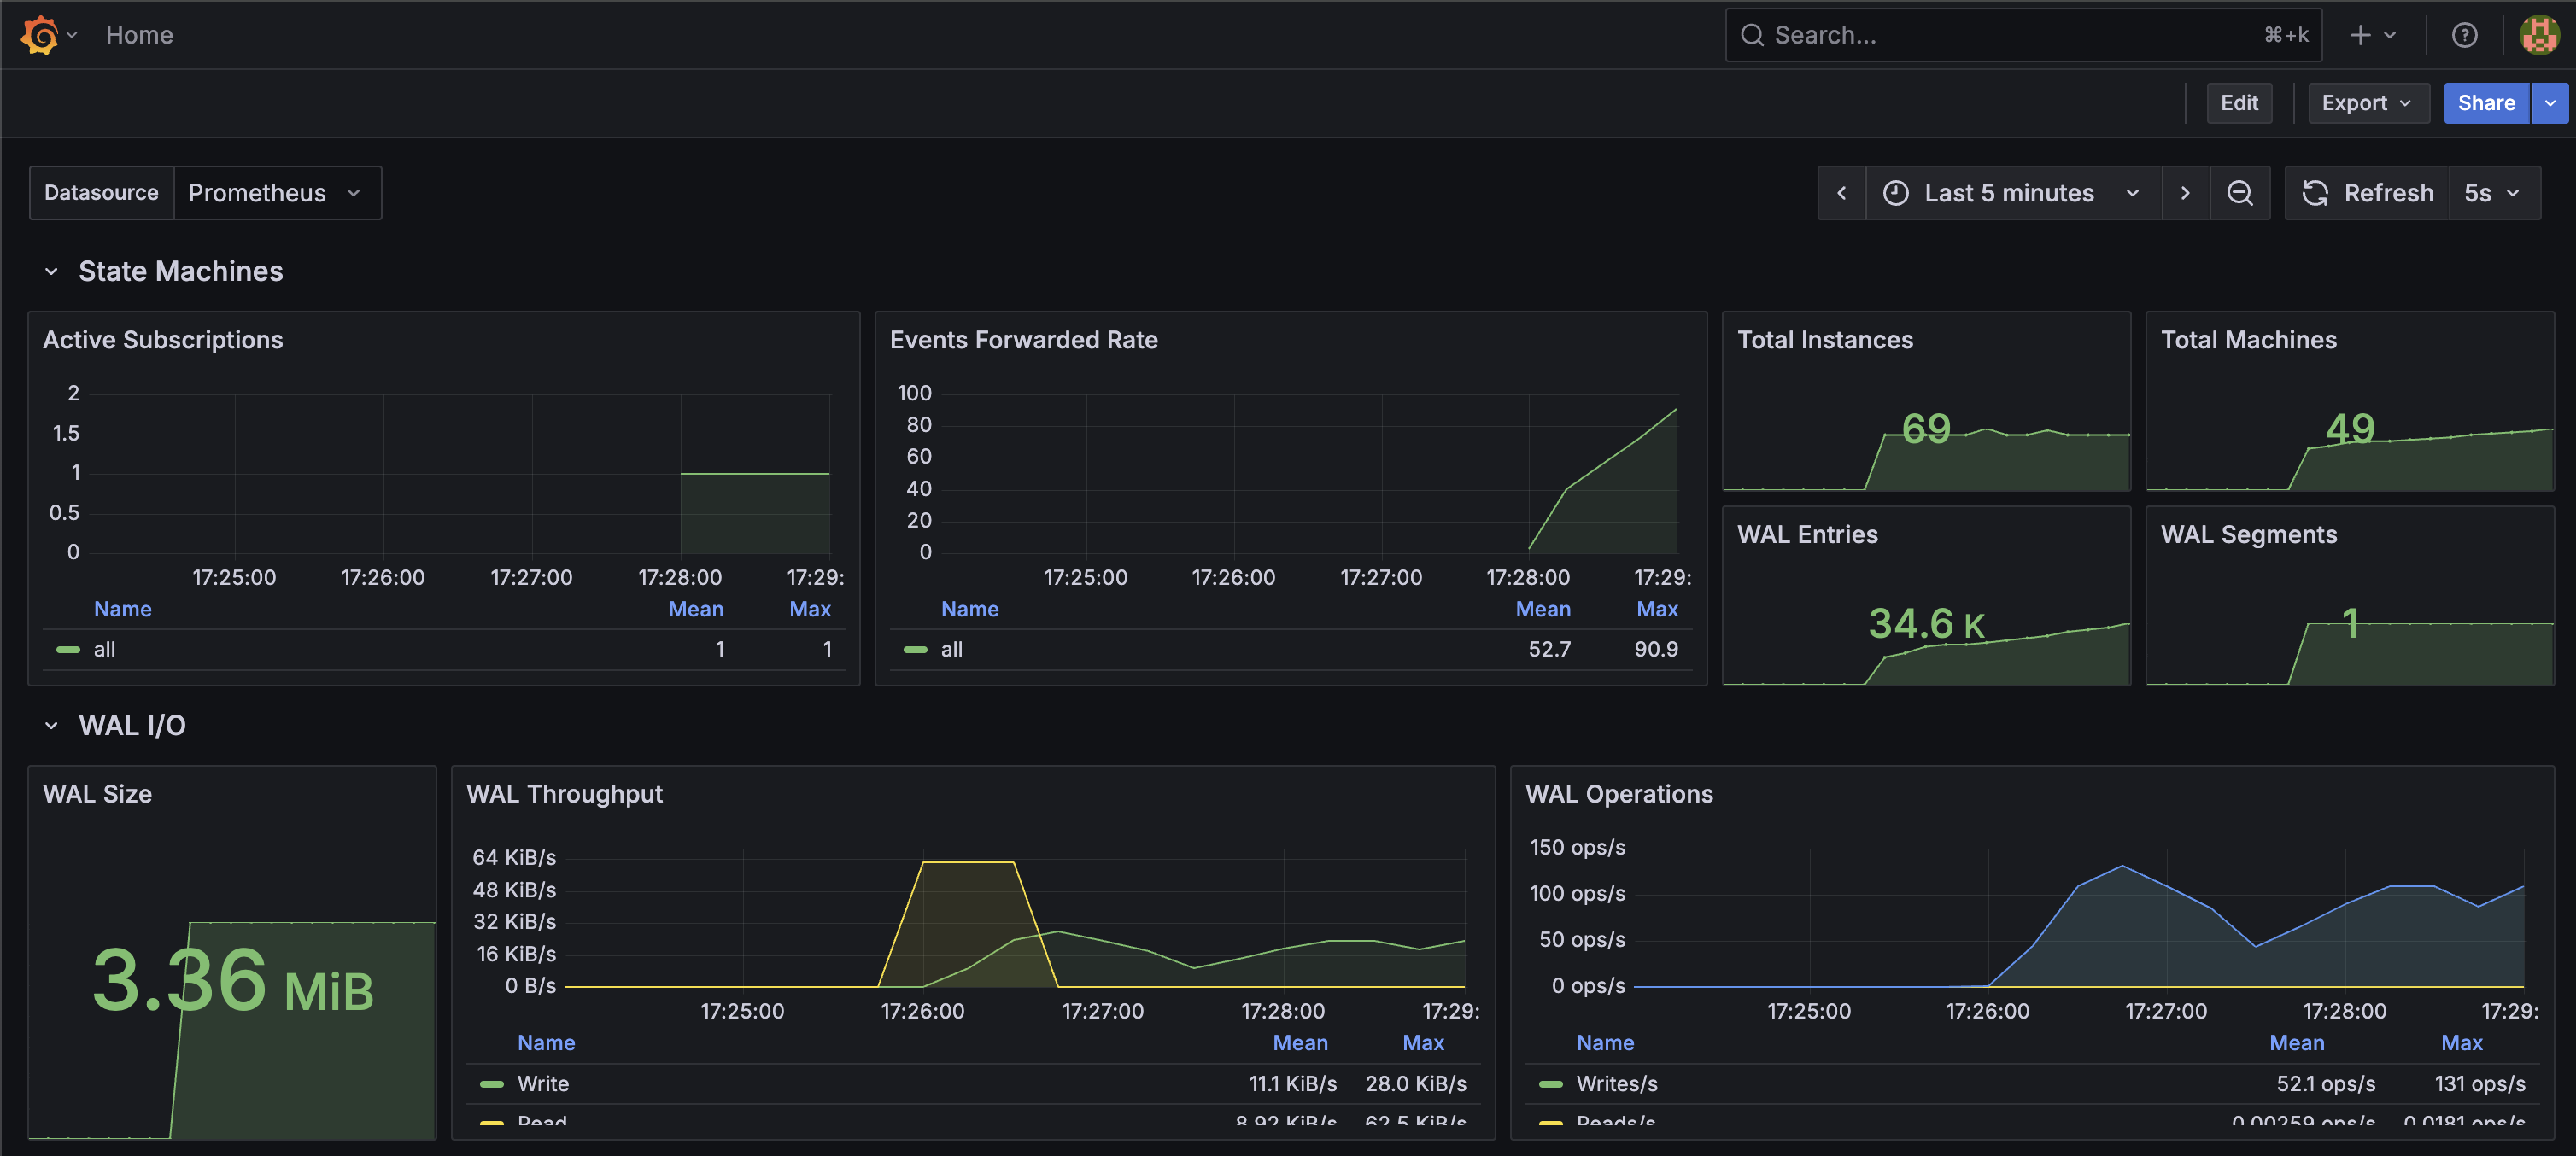
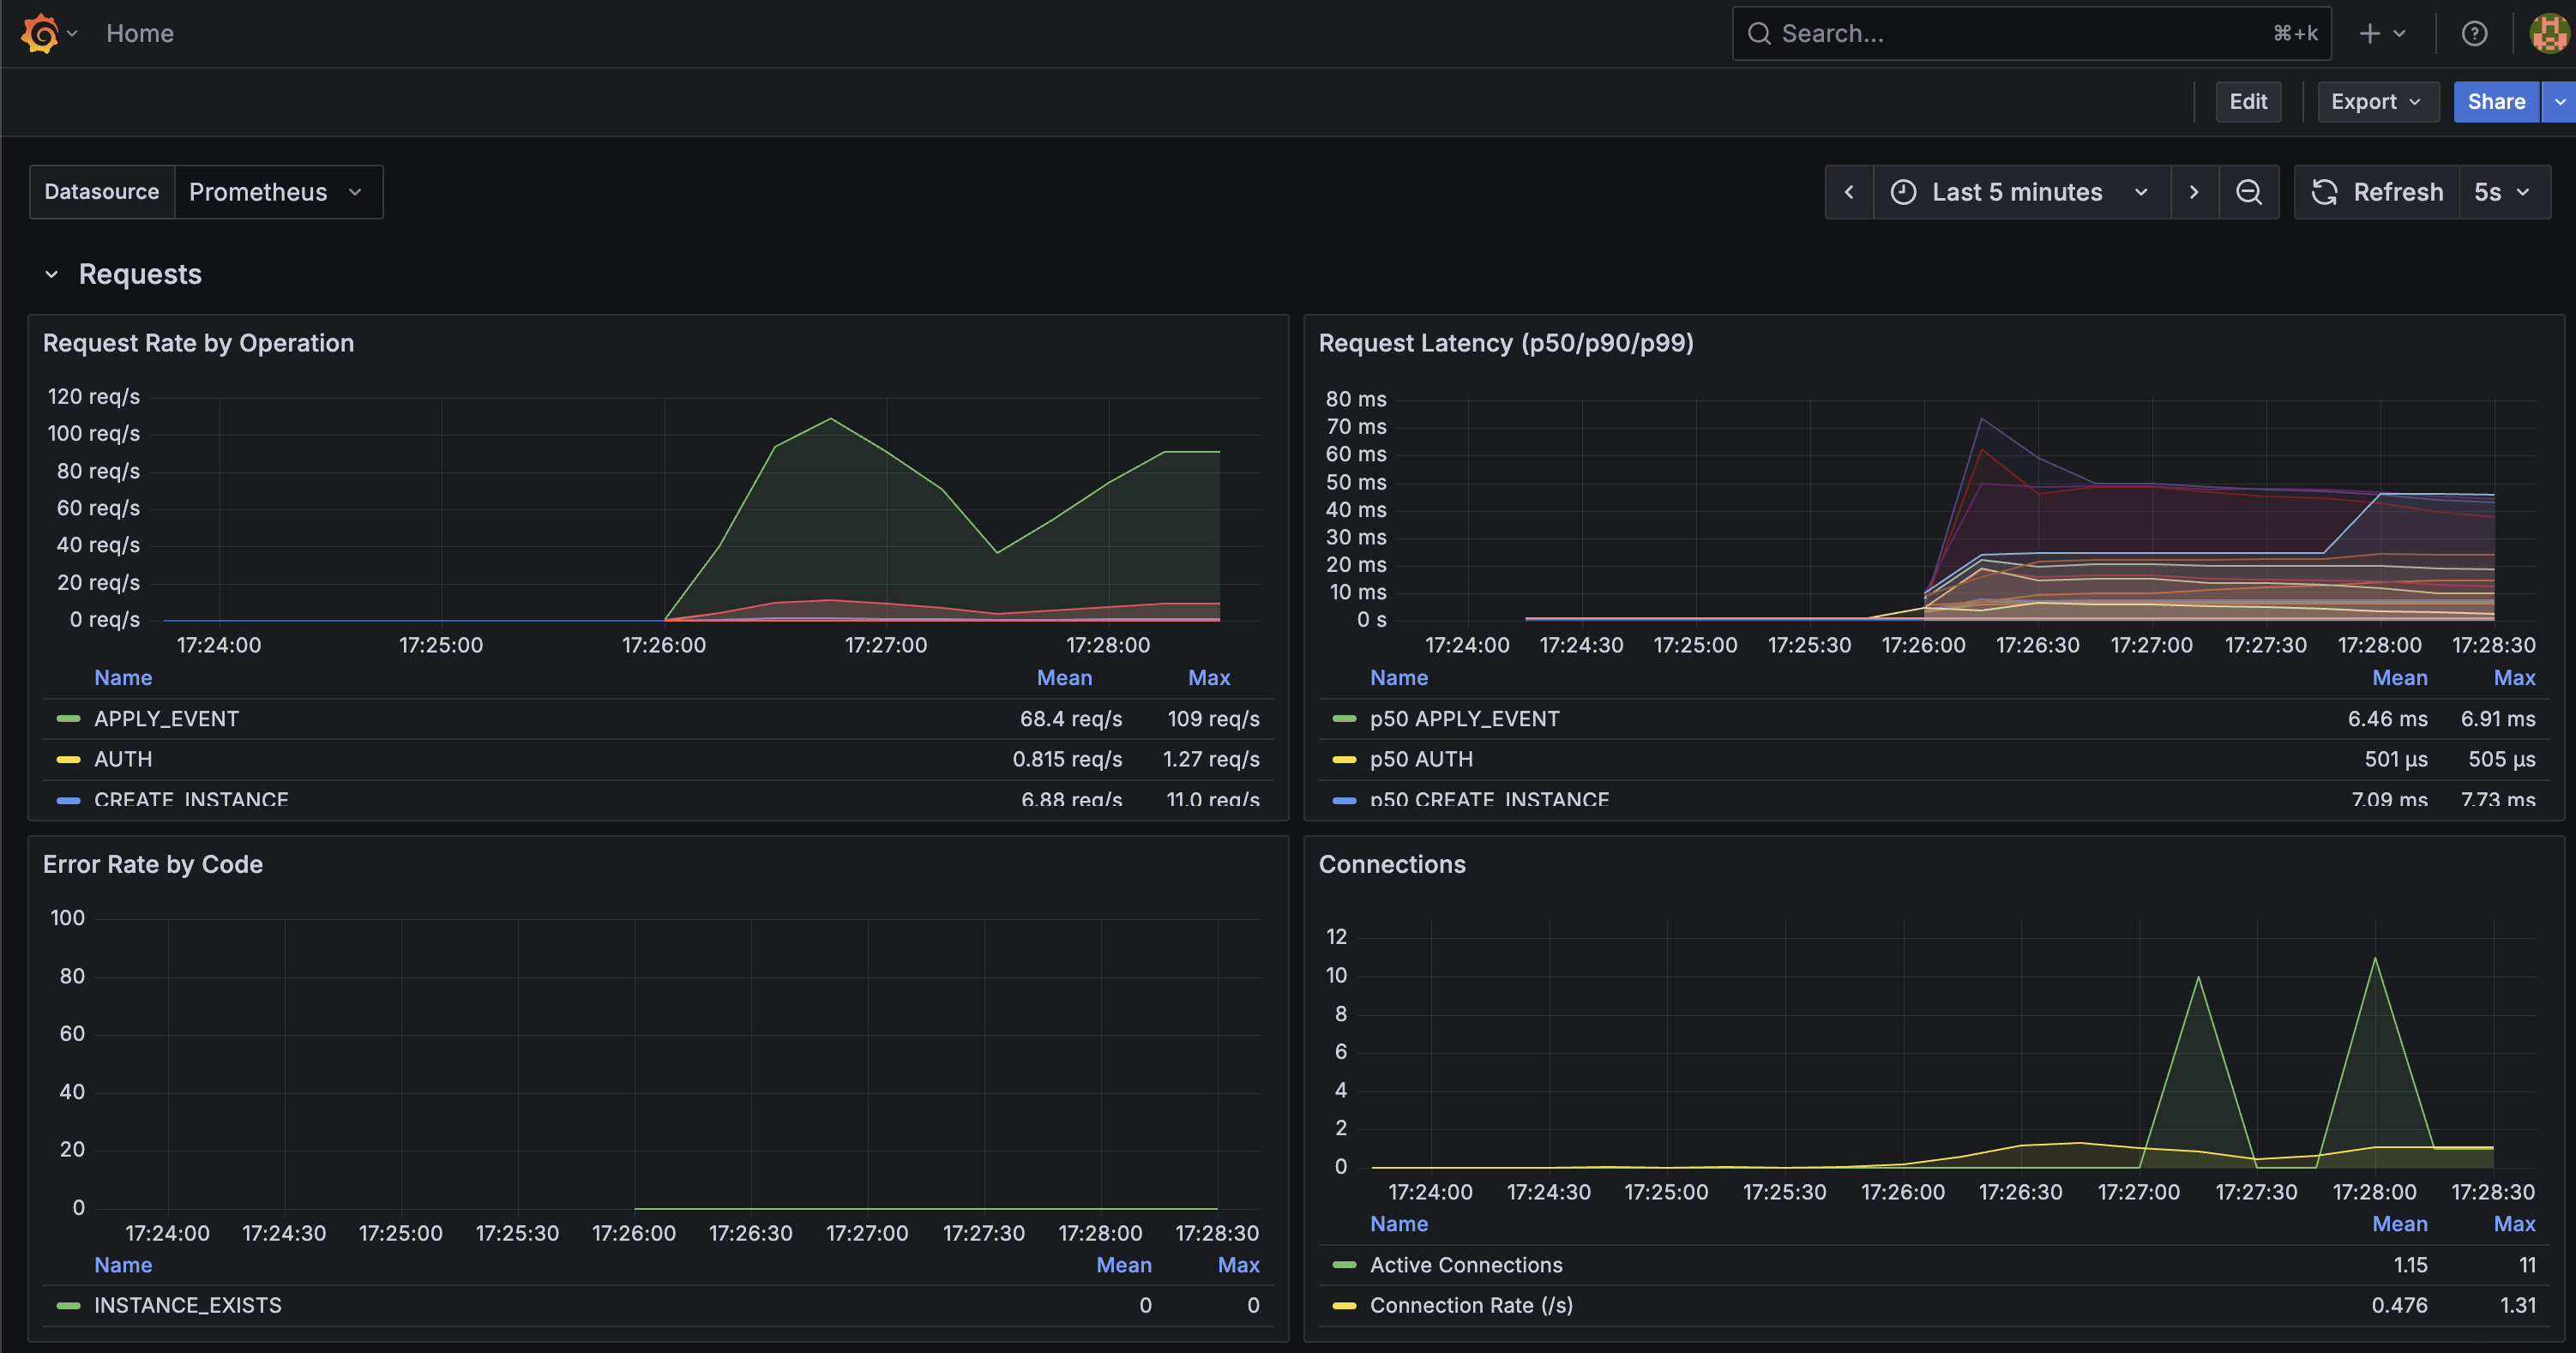
The rstmdb Monitoring dashboard uses the prometheus data source to create a Grafana dashboard with the stat and timeseries panels.
Data source config
Collector type:
Collector plugins:
Collector config:
Revisions
Upload an updated version of an exported dashboard.json file from Grafana
| Revision | Description | Created | |
|---|---|---|---|
| Download |