
EasyHPC Slurm Logs
EasyHPC Slurm Logs
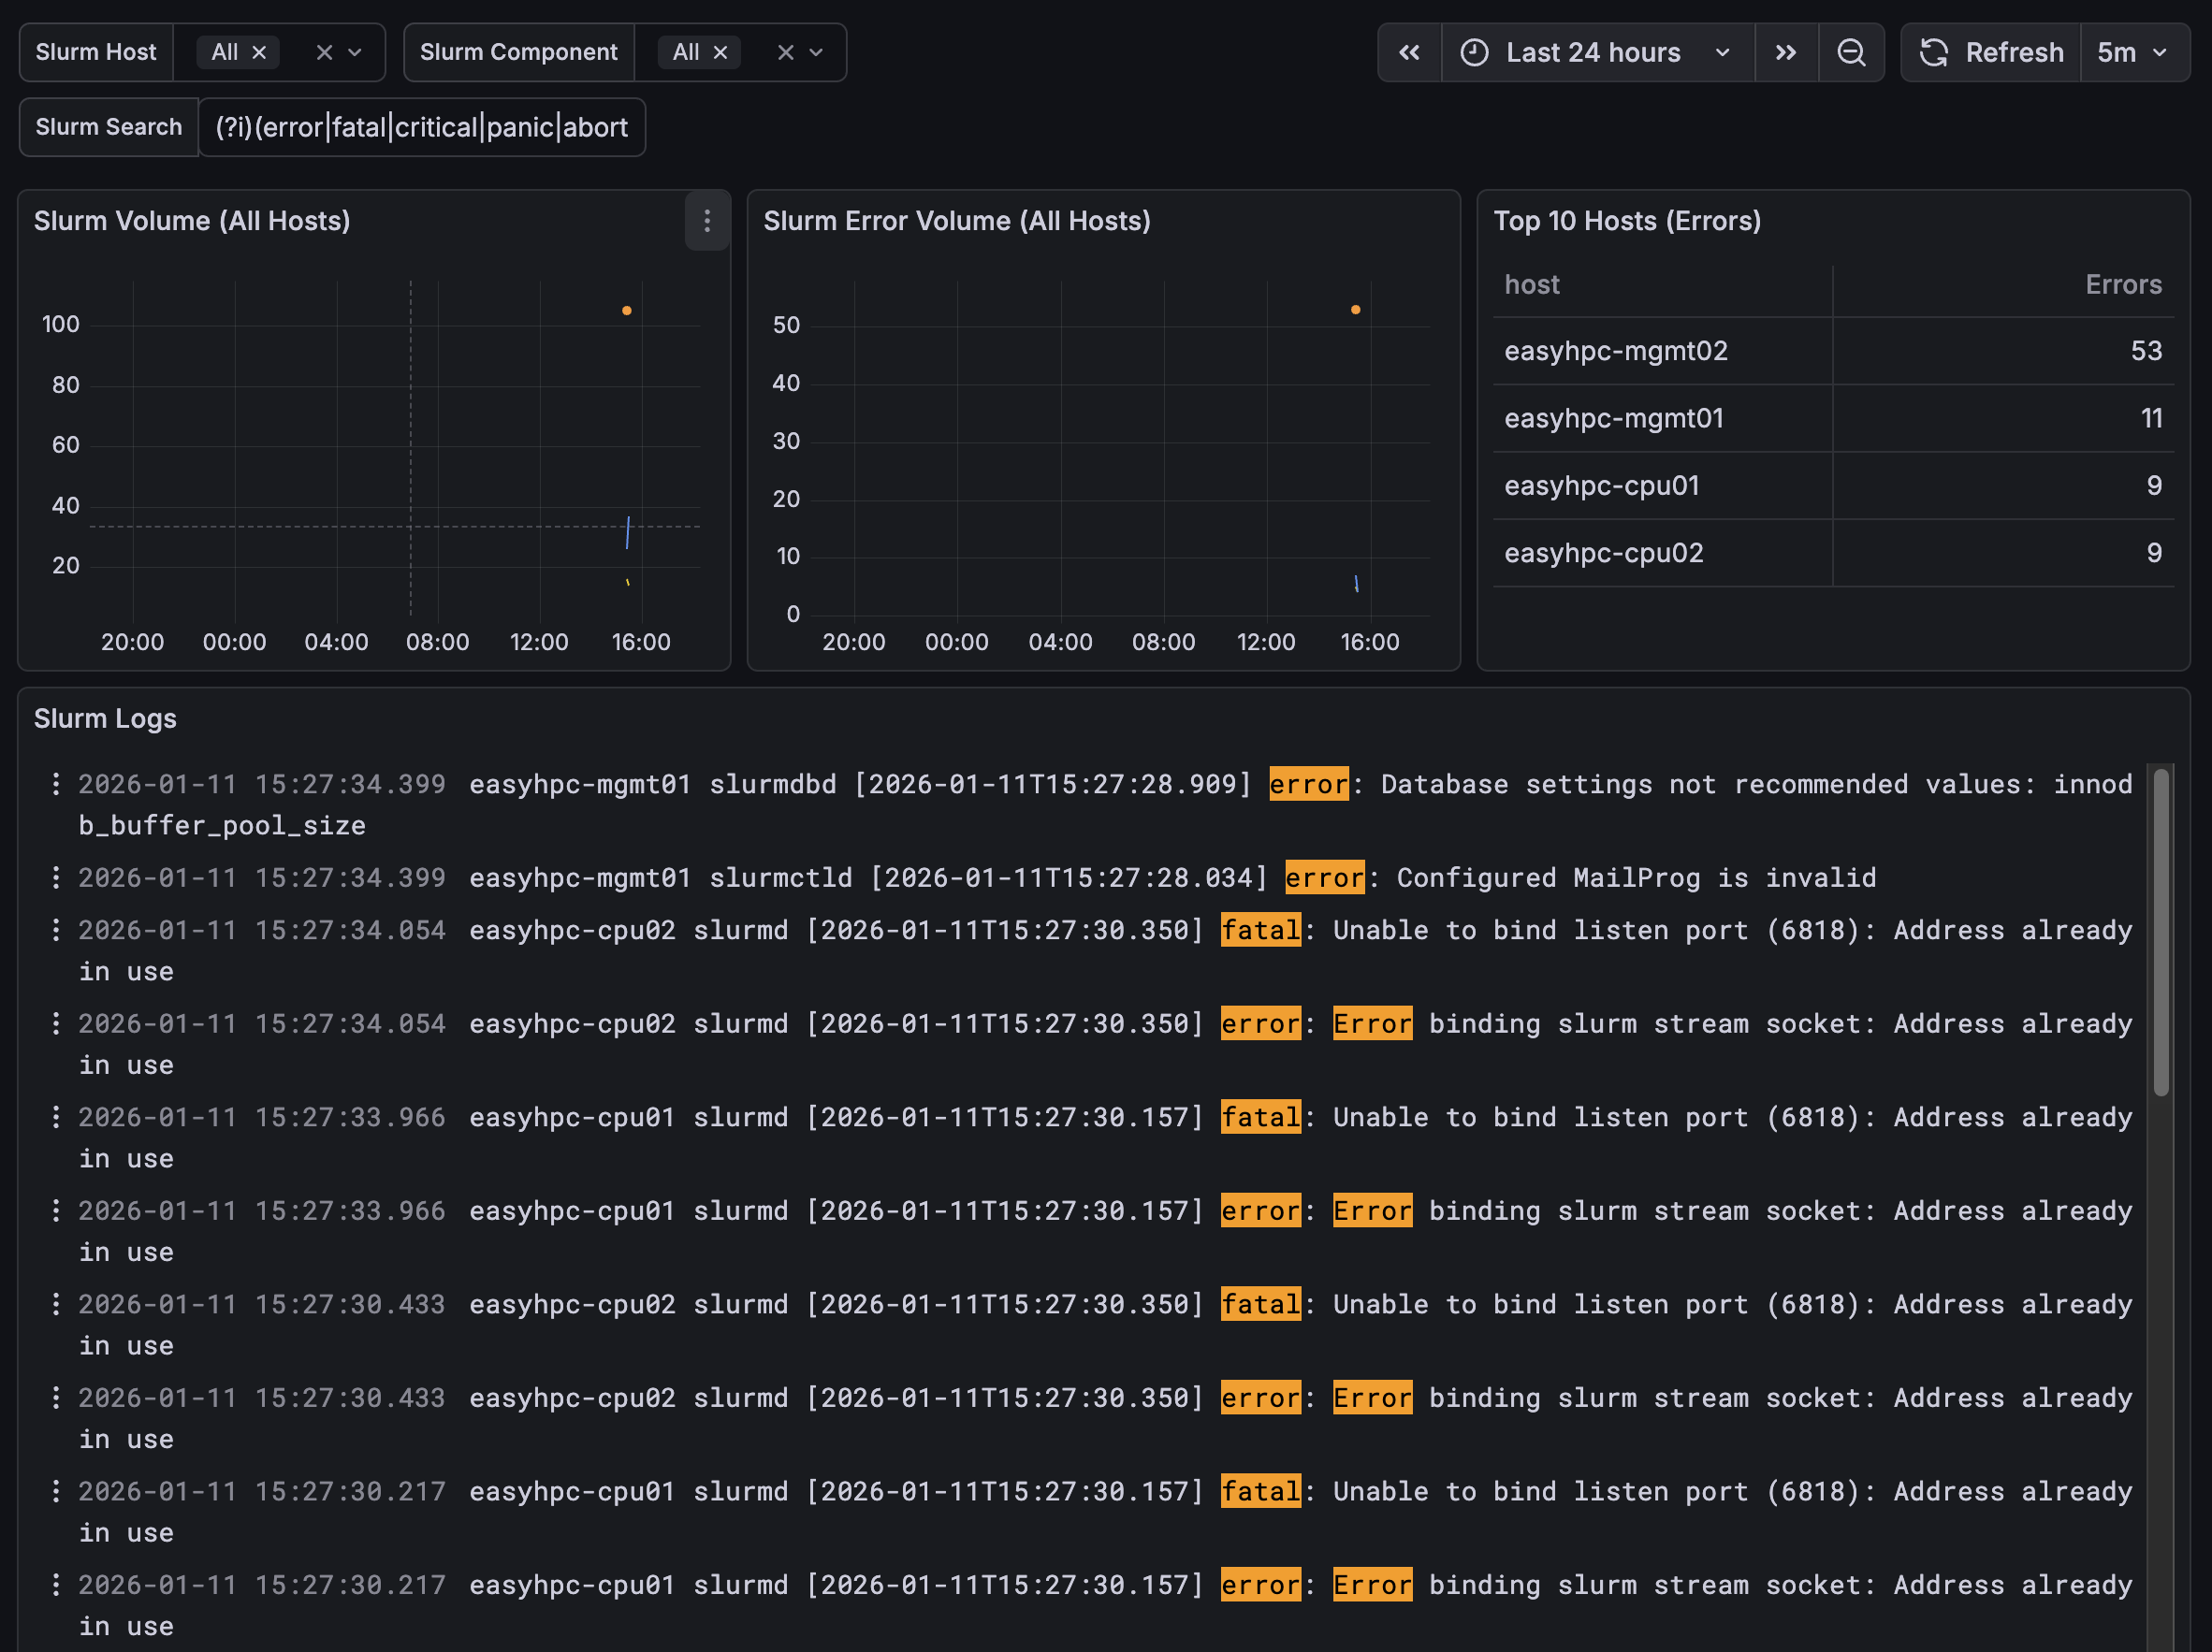
A Grafana dashboard for monitoring and analyzing Slurm workload manager logs in an EasyHPC environment using Loki.
It provides insight into Slurm log volume, error trends, and detailed log messages across hosts and Slurm components, enabling faster troubleshooting of scheduling and runtime issues.
Data source config
Collector type:
Collector plugins:
Collector config:
Revisions
Upload an updated version of an exported dashboard.json file from Grafana
| Revision | Description | Created | |
|---|---|---|---|
| Download |
Grafana Loki (self-hosted)
Easily monitor Grafana Loki (self-hosted), a horizontally scalable, highly available, multi-tenant log aggregation system inspired by Prometheus, with Grafana Cloud's out-of-the-box monitoring solution.
Learn more