
EXAScaler – SFA Aggregated Stats (Multi-Appliance)
Delivers a consolidated performance overview across multiple DDN SFA storage appliances. This dashboard aggregates Virtual Disk (VD) and Physical Disk (PD) metrics including throughput, IOPS, average latency, and IO size distributions, enabling fleet-wide capacity planning and performance comparison.
SFA Aggregated Stats (Multi-Appliance) The SFA Multi-Appliance dashboard provides a unified view of performance across multiple DDN SFA storage appliances. It visualizes aggregated VD and PD throughput, IOPS, average latency trends, and IO size patterns. This dashboard enables administrators to compare appliance performance, detect outliers, and monitor fleet-wide storage health.
What This Dashboard Shows
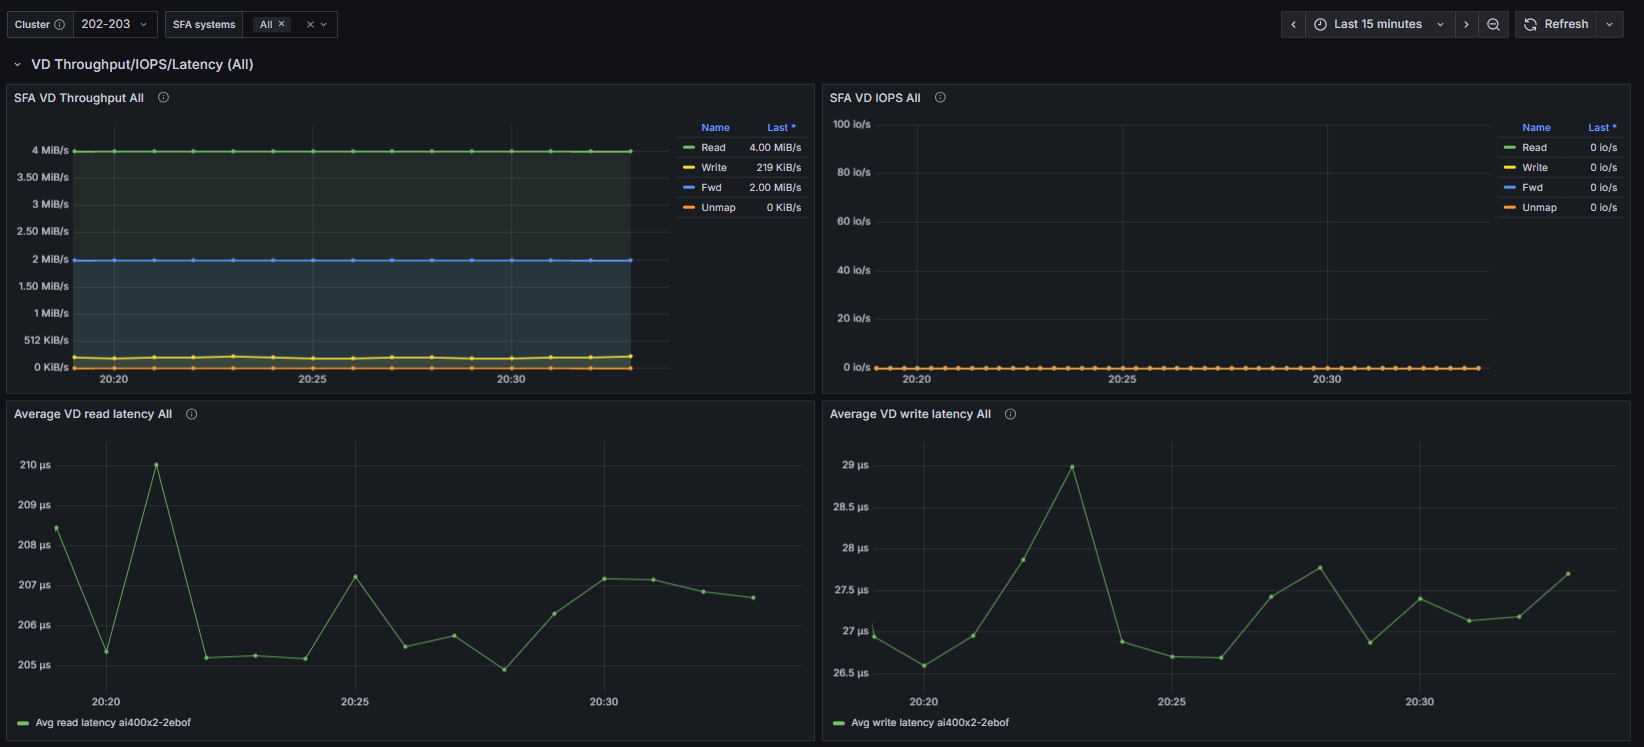
VD Throughput/IOPS/Latency
Panels derived from SFA exporter metrics:
- Combined VD Throughput across selected appliances (Read/Write/Fwd/Unmap)
- Combined VD IOPS
- Average VD Read/Write Latency per appliance (trend comparison)
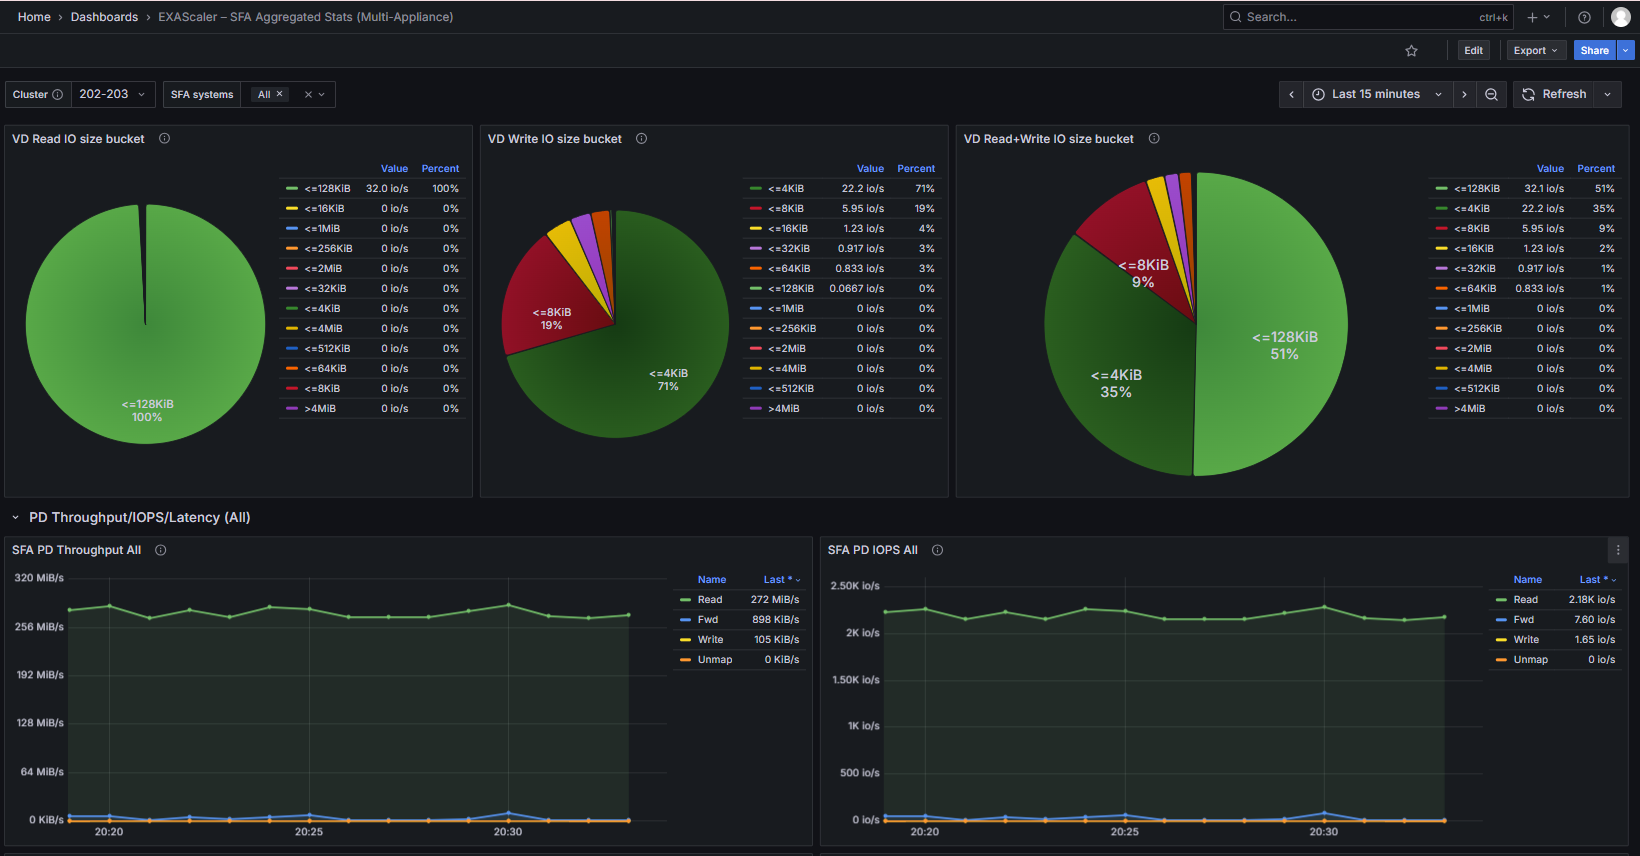
- VD IO Size Distribution (Read/Write/Combined pie charts)
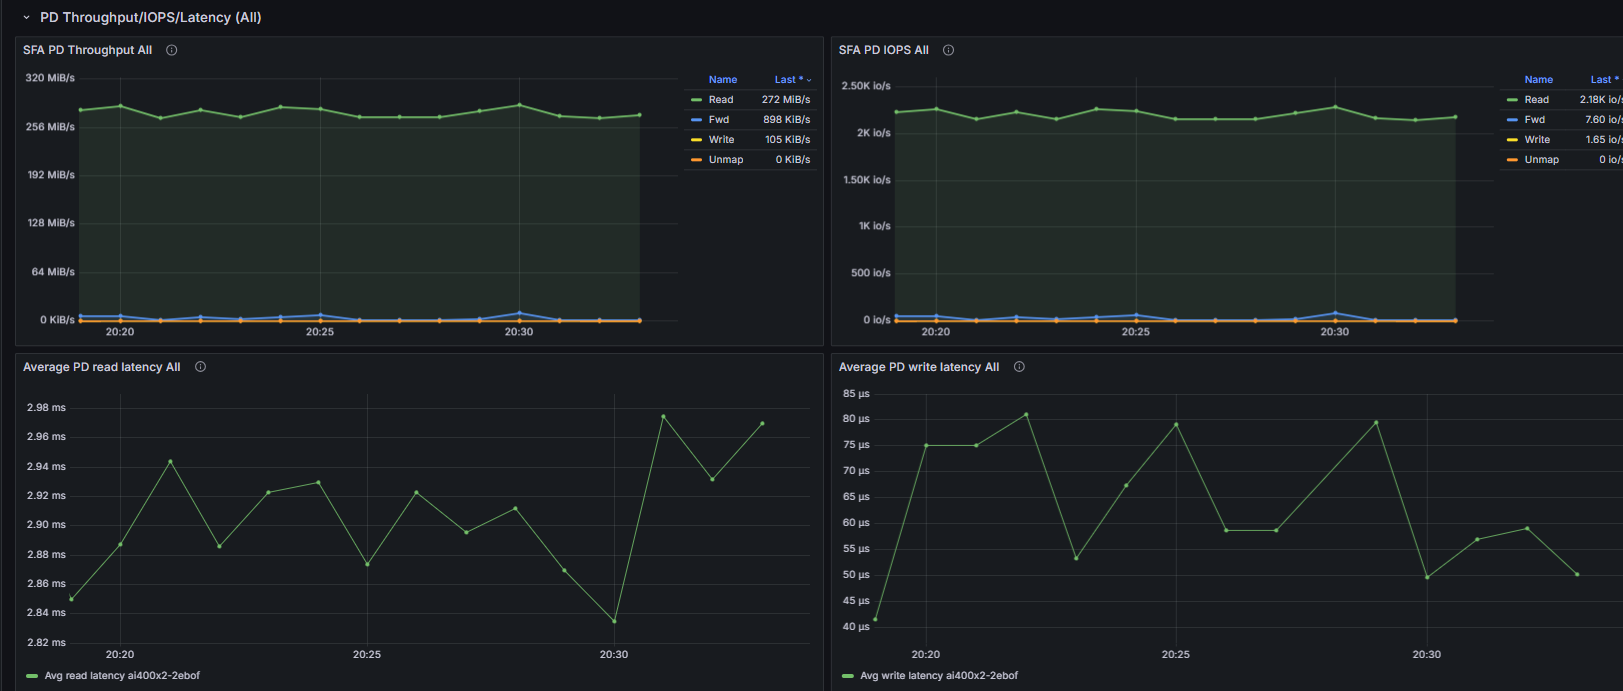
PD Throughput/IOPS/Latency
Physical disk level metrics:
- Combined PD Throughput across selected appliances
- Combined PD IOPS
- Average PD Read/Write Latency per appliance
How Metrics Are Collected
Metrics for this dashboard are collected using:
- OpenTelemetry Collector
- Configured with a Prometheus receiver to scrape:
- SFA Exporter (DDN SFA appliance metrics via API)
Notes
- This dashboard is parameterized via $cluster and $sfa_host (multi-select) variables.
- All queries use PromQL and are compatible with any Prometheus remote-read endpoint.
- For detailed per-disk analysis, use the Single Appliance dashboard.
Data source config
Collector config:
Upload an updated version of an exported dashboard.json file from Grafana
| Revision | Description | Created | |
|---|---|---|---|
| Download |