
Kafka Dashboard
Comprehensive Grafana dashboard for monitoring Apache Kafka clusters deployed with Strimzi Operator on Kubernetes. Works out-of-the-box with standard JMX Prometheus Exporter metrics (java_lang_*). Includes JVM metrics, broker performance, disk space, and cluster health monitoring. Compatible with KRaft mode.
Strimzi Kafka Dashboard with JVM Metrics
A comprehensive Grafana dashboard for monitoring Apache Kafka clusters deployed with the Strimzi Kafka Operator on Kubernetes.
Note: This dashboard is a modified version of the official Strimzi Kafka dashboard. The main changes include:
- Updated JVM metric queries to use
java_lang_*metrics (the default output from JMX Prometheus Exporter)- Fixed label selectors to work with standard PodMonitor configurations
- Simplified pod/namespace filtering for better out-of-the-box compatibility
What This Dashboard Shows
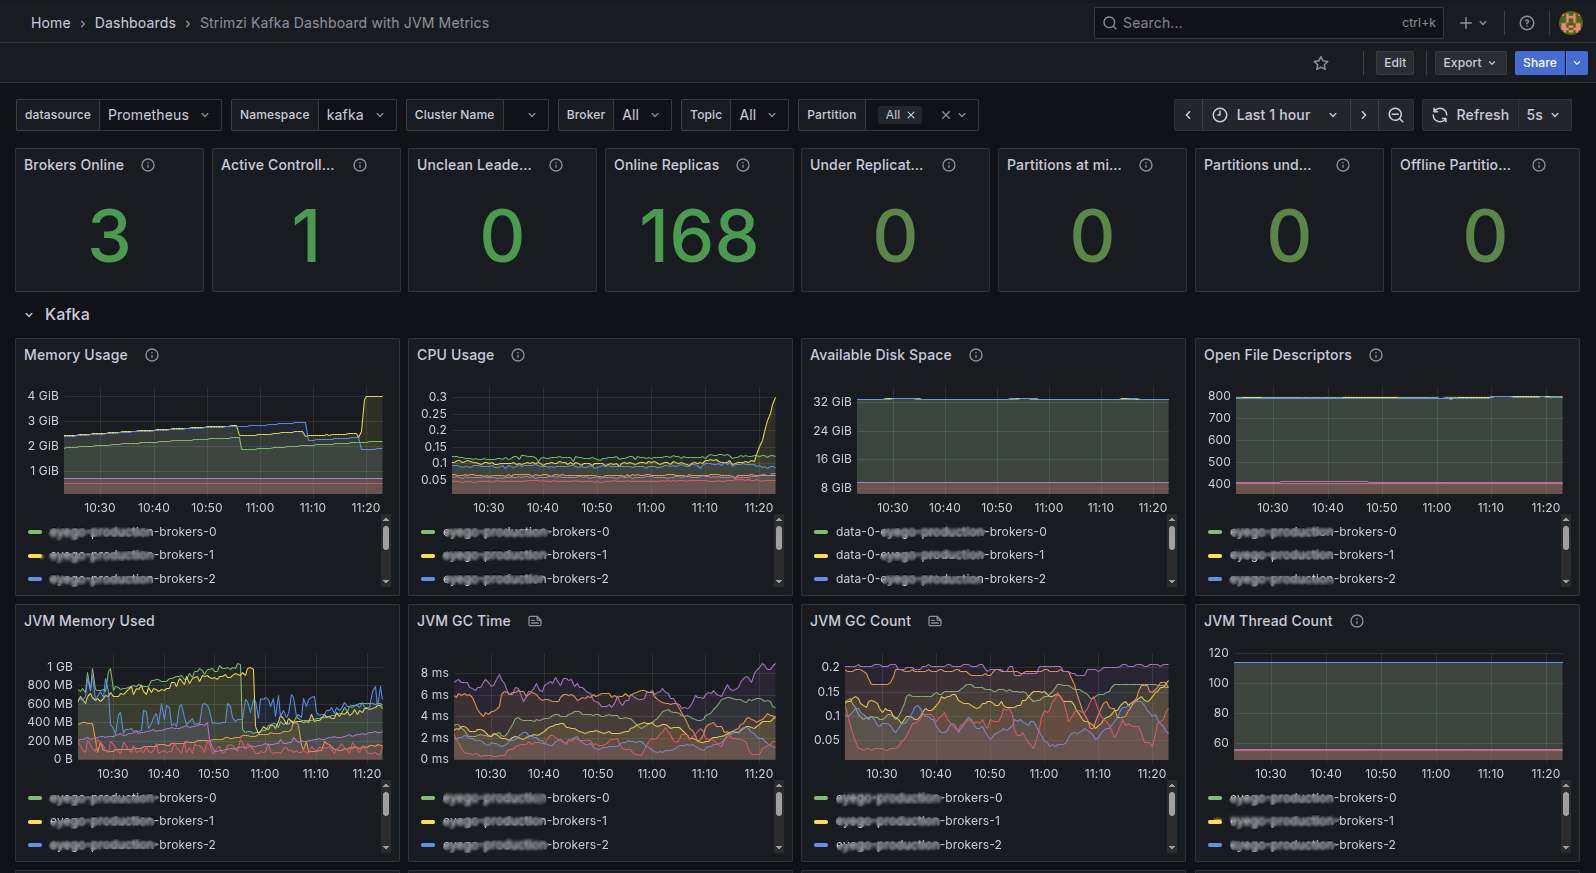
Cluster Health Overview
- Brokers Online - Number of active Kafka broker nodes
- Active Controllers - Number of active controllers (should be 1 in KRaft mode)
- Online Replicas - Total partition replicas across all brokers
- Under Replicated Partitions - Partitions with fewer replicas than configured
- Partitions at Minimum ISR - Partitions at their minimum in-sync replica count
- Offline Partitions - Partitions without an active leader
JVM Metrics
- JVM Memory Used - Heap memory usage per broker (
java_lang_memory_heapmemoryusage_used) - JVM GC Time - Garbage collection time (
java_lang_g1_young_generation_collectiontime) - JVM GC Count - Garbage collection frequency (
java_lang_g1_young_generation_collectioncount) - JVM Thread Count - Active JVM threads per broker (
java_lang_threading_threadcount)
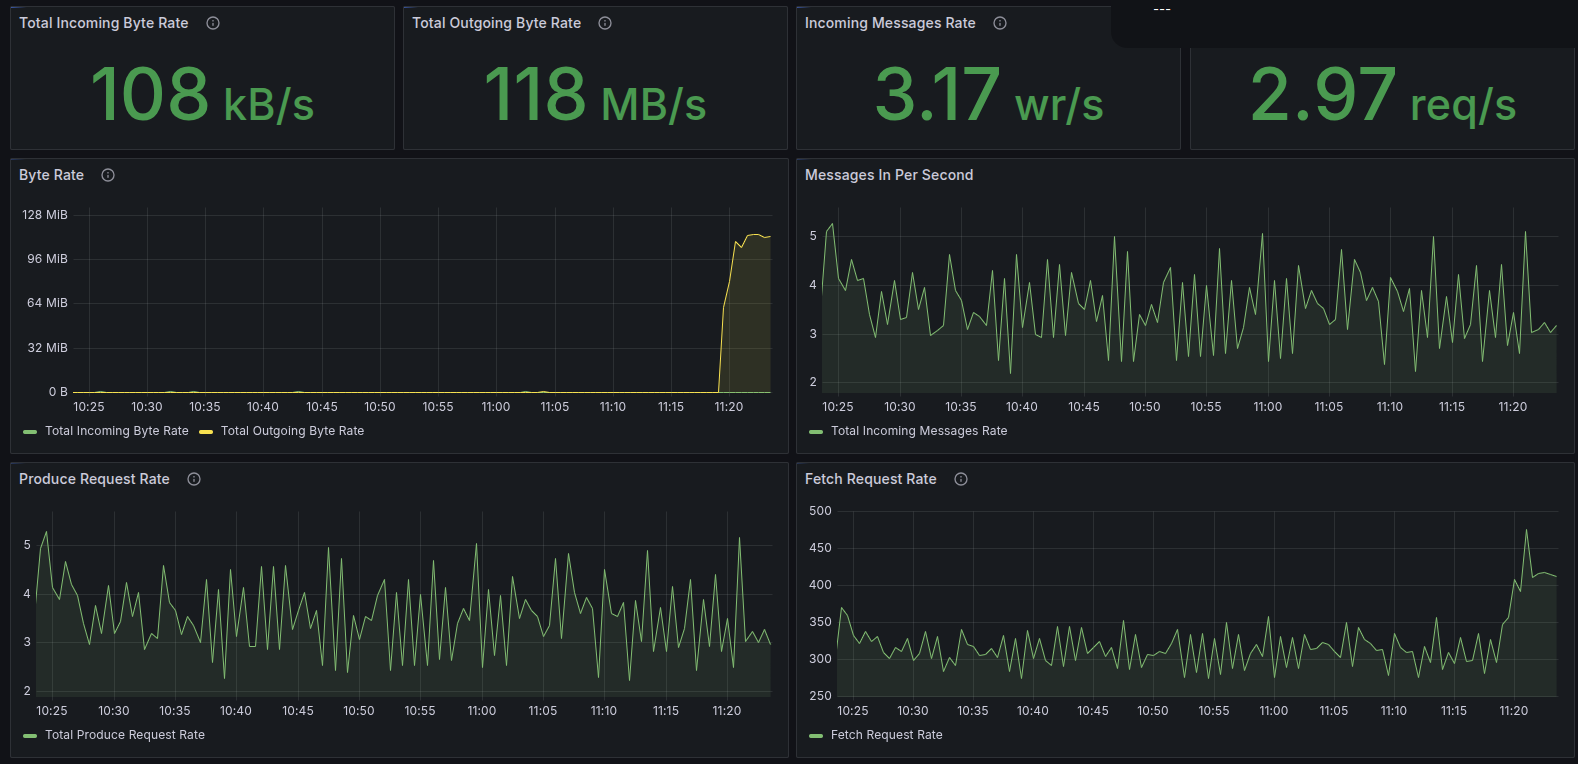
Broker Performance
- Incoming/Outgoing Byte Rate - Network throughput per broker and topic
- Incoming Messages Rate - Message ingestion rate
- Produce/Fetch Request Rates - Client request metrics
- Failed Produce/Fetch Requests - Error tracking
System Resources
- Memory Usage - Container memory consumption
- CPU Usage - Container CPU utilization
- Available Disk Space - PVC storage availability
- Open File Descriptors - File handle usage
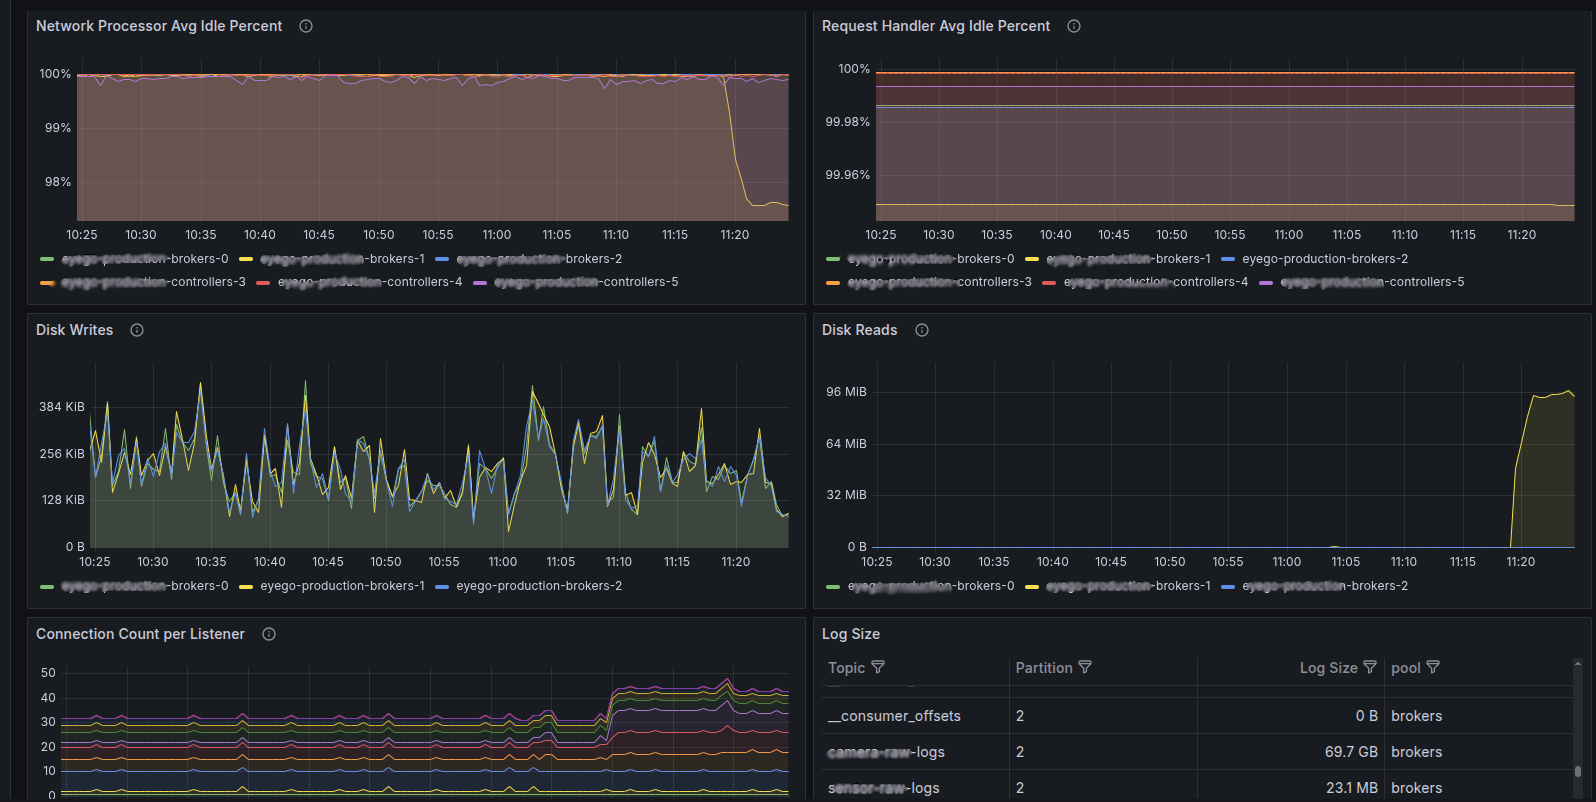
Network & Performance
- Network Processor Idle % - Network thread utilization
- Request Handler Idle % - Request processing capacity
- Disk Read/Write Bytes - Storage I/O metrics
- Connection Count - Active client connections
- Log Size - Topic/partition storage usage
Key Modifications from Official Dashboard
| Original Query | Modified Query |
|---|---|
jvm_memory_used_bytes | java_lang_memory_heapmemoryusage_used |
jvm_threads_current | java_lang_threading_threadcount |
jvm_gc_collection_seconds_count | java_lang_g1_young_generation_collectioncount |
jvm_gc_collection_seconds_sum | java_lang_g1_young_generation_collectiontime |
kubernetes_pod_name label | pod label |
Complex strimzi_io_* label filters | Simplified namespace-based filters |
How Metrics Are Collected
This dashboard uses metrics from the JMX Prometheus Exporter built into Strimzi Kafka pods. The exporter converts JMX MBeans to Prometheus format and exposes them on port 9404.
Metric Sources
| Metric Prefix | Source | Description |
|---|---|---|
kafka_* | Kafka JMX MBeans | Broker, controller, and cluster metrics |
java_lang_* | JVM JMX MBeans | Memory, GC, threading metrics |
container_* | cAdvisor | Container resource usage |
kubelet_volume_stats_* | Kubelet | PVC disk space metrics |
Prerequisites
- Strimzi Kafka Operator v0.38+ installed on Kubernetes
- Prometheus Operator for metrics collection
- Apache Kafka 3.x or 4.x (KRaft mode supported)
Setup Instructions
1. Enable Metrics in Strimzi Kafka
Add metricsConfig to your Kafka custom resource:
apiVersion: kafka.strimzi.io/v1beta2
kind: Kafka
metadata:
  name: my-cluster
spec:
  kafka:
    version: 4.0.0
    metricsConfig:
      type: jmxPrometheusExporter
      valueFrom:
        configMapKeyRef:
          name: kafka-metrics
          key: kafka-metrics-config.yml
2. Create the Metrics ConfigMap
apiVersion: v1
kind: ConfigMap
metadata:
  name: kafka-metrics
  namespace: kafka
data:
  kafka-metrics-config.yml: |
    lowercaseOutputName: true
    rules:
    # Kafka broker metrics
    - pattern: kafka.server<type=(.+), name=(.+), clientId=(.+), topic=(.+), partition=(.*)><>Value
      name: kafka_server_$1_$2
      type: GAUGE
      labels:
        clientId: "$3"
        topic: "$4"
        partition: "$5"
    - pattern: kafka.(\w+)<type=(.+), name=(.+)PerSec\w*><>Count
      name: kafka_$1_$2_$3_total
      type: COUNTER
    - pattern: kafka.(\w+)<type=(.+), name=(.+)><>Value
      name: kafka_$1_$2_$3
      type: GAUGE
    # Catch all remaining metrics
    - pattern: "kafka.*"
    - pattern: "java.lang<.*>"
3. Create a PodMonitor for Prometheus
apiVersion: monitoring.coreos.com/v1
kind: PodMonitor
metadata:
  name: kafka-metrics
  namespace: monitoring
  labels:
    release: prometheus  # Match your Prometheus selector
spec:
  namespaceSelector:
    matchNames:
      - kafka
  selector:
    matchLabels:
      strimzi.io/kind: Kafka
  podMetricsEndpoints:
    - port: tcp-prometheus
      path: /metrics
      interval: 30s
4. Import the Dashboard
- Go to Grafana → Dashboards → Import
- Upload this JSON file or paste the dashboard ID
- Select your Prometheus data source
- Set the Namespace variable to your Kafka namespace (e.g.,
kafka)
Dashboard Variables
| Variable | Description | Default |
|---|---|---|
datasource | Prometheus data source | - |
kubernetes_namespace | Kubernetes namespace | kafka |
strimzi_cluster_name | Strimzi cluster name | - |
kafka_broker | Filter by broker | All |
kafka_topic | Filter by topic | All |
kafka_partition | Filter by partition | All |
Compatibility
- ✅ Strimzi Kafka Operator v0.38+
- ✅ Apache Kafka 3.x / 4.x
- ✅ KRaft mode (no ZooKeeper)
- ✅ Kubernetes with Prometheus Operator
- ✅ Grafana 9.0+
Credits
- Original dashboard by Strimzi Project
- Modified for
java_lang_*JVM metrics compatibility
Links
Data source config
Collector config:
Upload an updated version of an exported dashboard.json file from Grafana
| Revision | Description | Created | |
|---|---|---|---|
| Download |
Kafka
Easily monitor your Kafka deployment with Grafana Cloud's out-of-the-box monitoring solution.
Learn more