
Alloy Modular Pipeline Demo
A reference dashboard for the alloy-config-template POC, demonstrating modular pipeline architectures, regex log parsing, and metric generation.
Alloy Configuration Template Dashboard
This dashboard serves as a visualization layer for the Grafana Alloy Modular Configuration POC. It is designed to demonstrate the real-time processing, parsing, and metric generation capabilities of Grafana Alloy using modular pipelines.
Data Collection & Pipeline
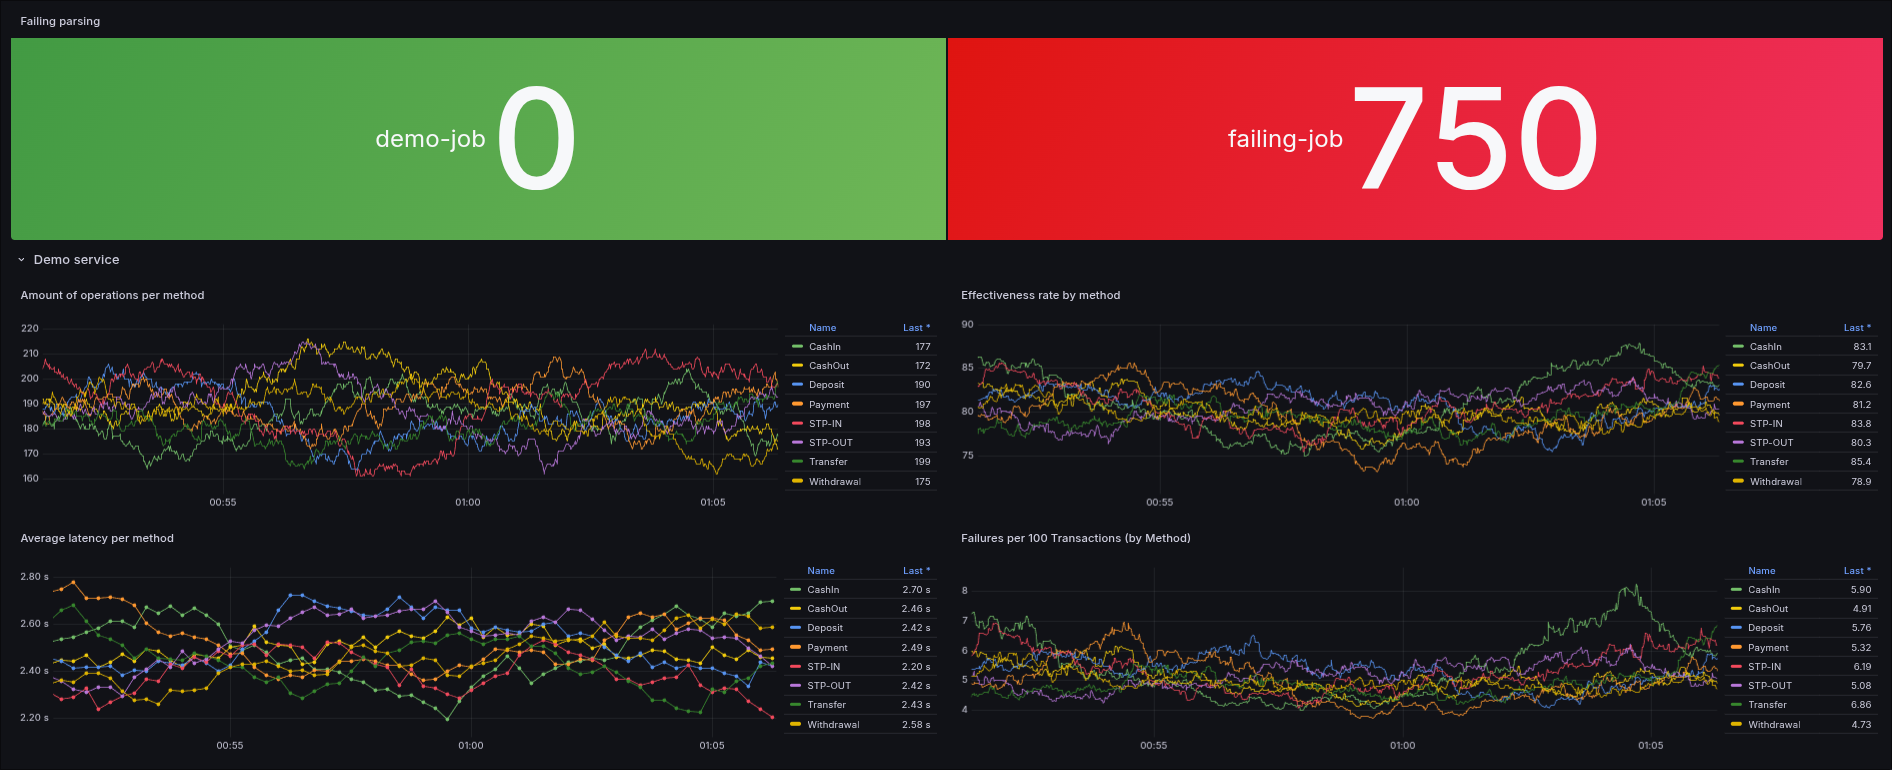
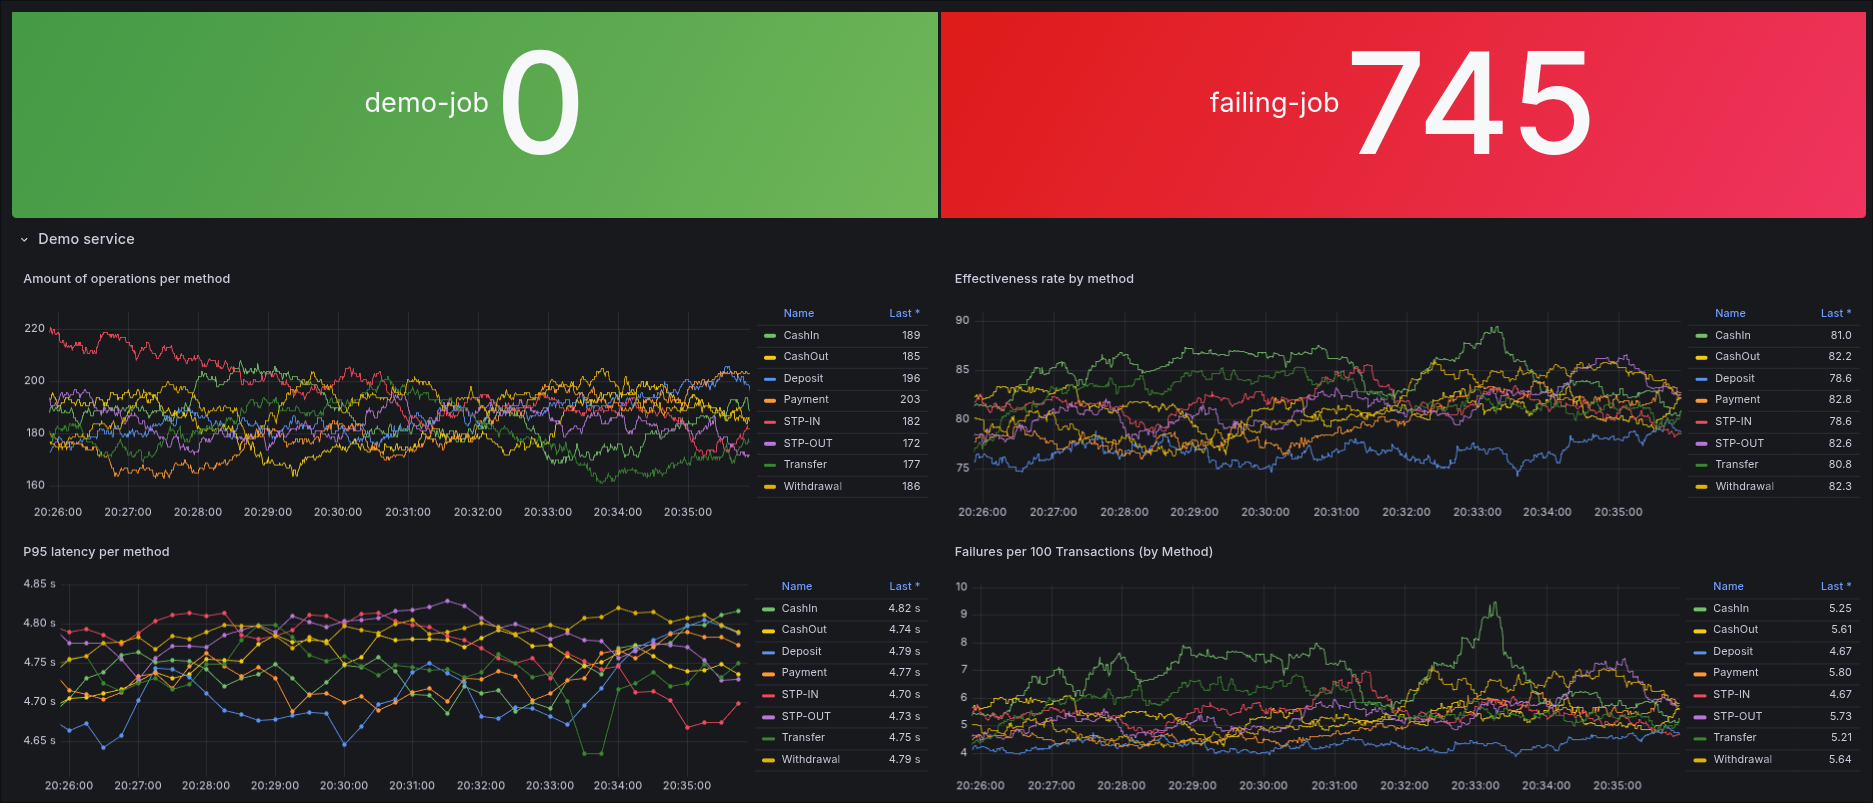
The pipeline implements a fail-first validation pattern to ensure visibility into log processing health.
1. Ingestion
Logs are generated by a Python script in two distinct pipe-delimited formats to simulate inconsistent log sources:
- Format 1:
date|start_time|end_time|latency_ms|method|detail|status|code - Format 2:
|date|start_time|end_time|latency_ms|method|detail|status|code|
2. Processing (Grafana Alloy)
The configuration uses a modular approach, importing specialized pipeline components (template.alloy and failing.alloy) into a main config.alloy file. The processing stages include:
- Multi-Format Parsing: Using
stage.regexto handle both standard and wrapped pipe-delimited formats. - Dynamic Labeling: Extracting fields like
method,status, andstatus_codeinto Loki labels for efficient querying. - Validation: Every log starts with
parse_status="failed". Only if the regex successfully extracts amethodvalue is the label updated toparse_status="success".
3. Metric Generation
The dashboard visualizes Prometheus metrics generated directly from the log stream:
- Transaction Latency: A histogram metric named
transaction_latencyis created from the extractedlatencydata. - Metric Prefix: All generated metrics use the
template_prefix for easy discovery.
Project Repository
This dashboard is part of a larger Proof of Concept demonstrating modular Alloy configuration architectures. The full source code, including the log generator, pipeline configurations, and the Docker Compose infrastructure, can be found here:
https://github.com/m0r4a/alloy-config-demo
Disclaimer
Do not use this dashboard for production environments.
This configuration is intended solely for educational and demonstration purposes to validate specific parsing logic and modular import patterns in Grafana Alloy. It lacks the necessary security hardening and high availability required for production monitoring.
Data source config
Collector config:
Upload an updated version of an exported dashboard.json file from Grafana
| Revision | Description | Created | |
|---|---|---|---|
| Download |
Grafana Alloy
Easily monitor the health of Grafana Alloy, an open source distribution of the OpenTelemetry Collector, with Grafana Cloud's out-of-the-box monitoring solution.
Learn more