
AgentGateway Overview
Dashboard for monitoring AgentGateway - AI Gateway with rate limiting, content guardrails, and MCP support
AgentGateway Grafana Dashboard
Dashboard for monitoring AgentGateway - an AI Gateway providing rate limiting, content guardrails, and MCP (Model Context Protocol) support.
Dashboard Sections
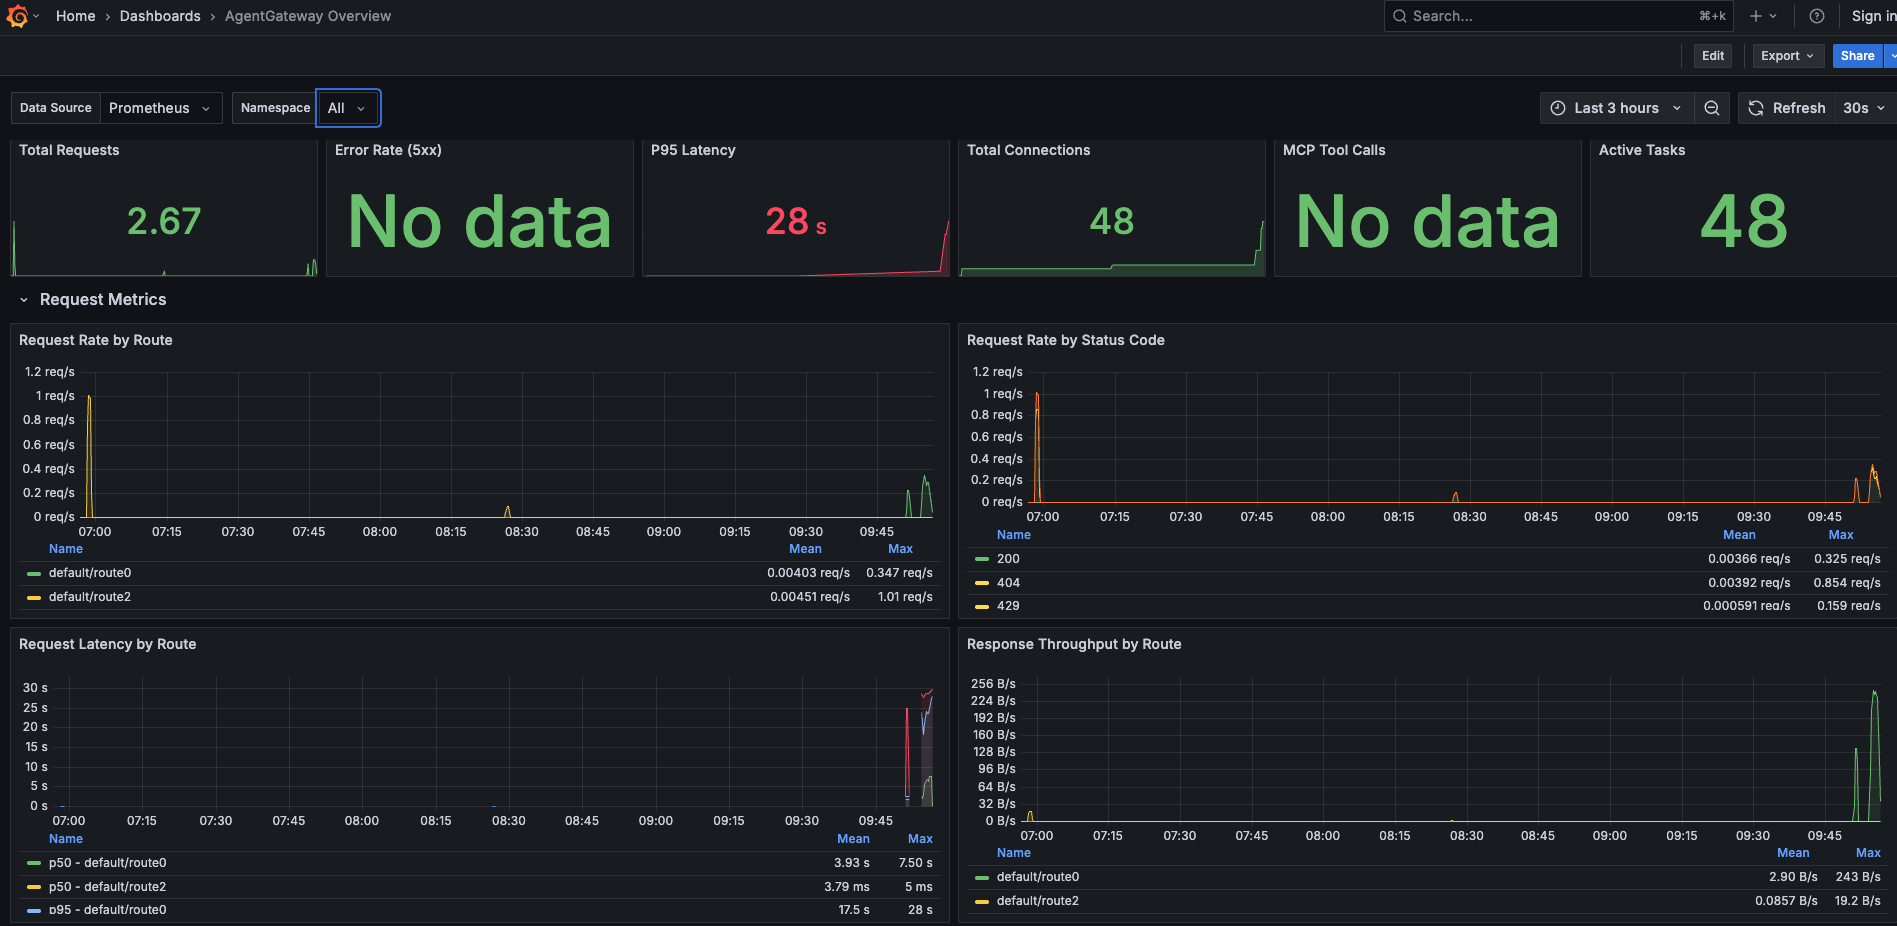
Overview
High-level KPIs at a glance:
- Total Requests - Aggregate request count
- Error Rate (5xx) - Percentage of server errors
- P95 Latency - 95th percentile response time
- Total Connections - Downstream connection count
- MCP Tool Calls - Total MCP operations
- Active Tasks - Tokio runtime active tasks
Request Metrics
HTTP traffic analysis:
- Request Rate by Route - Requests/sec broken down by route
- Request Rate by Status Code - Success vs error response distribution
- Request Latency by Route - Response time heatmap per route
- Response Throughput by Route - Bytes transferred per route
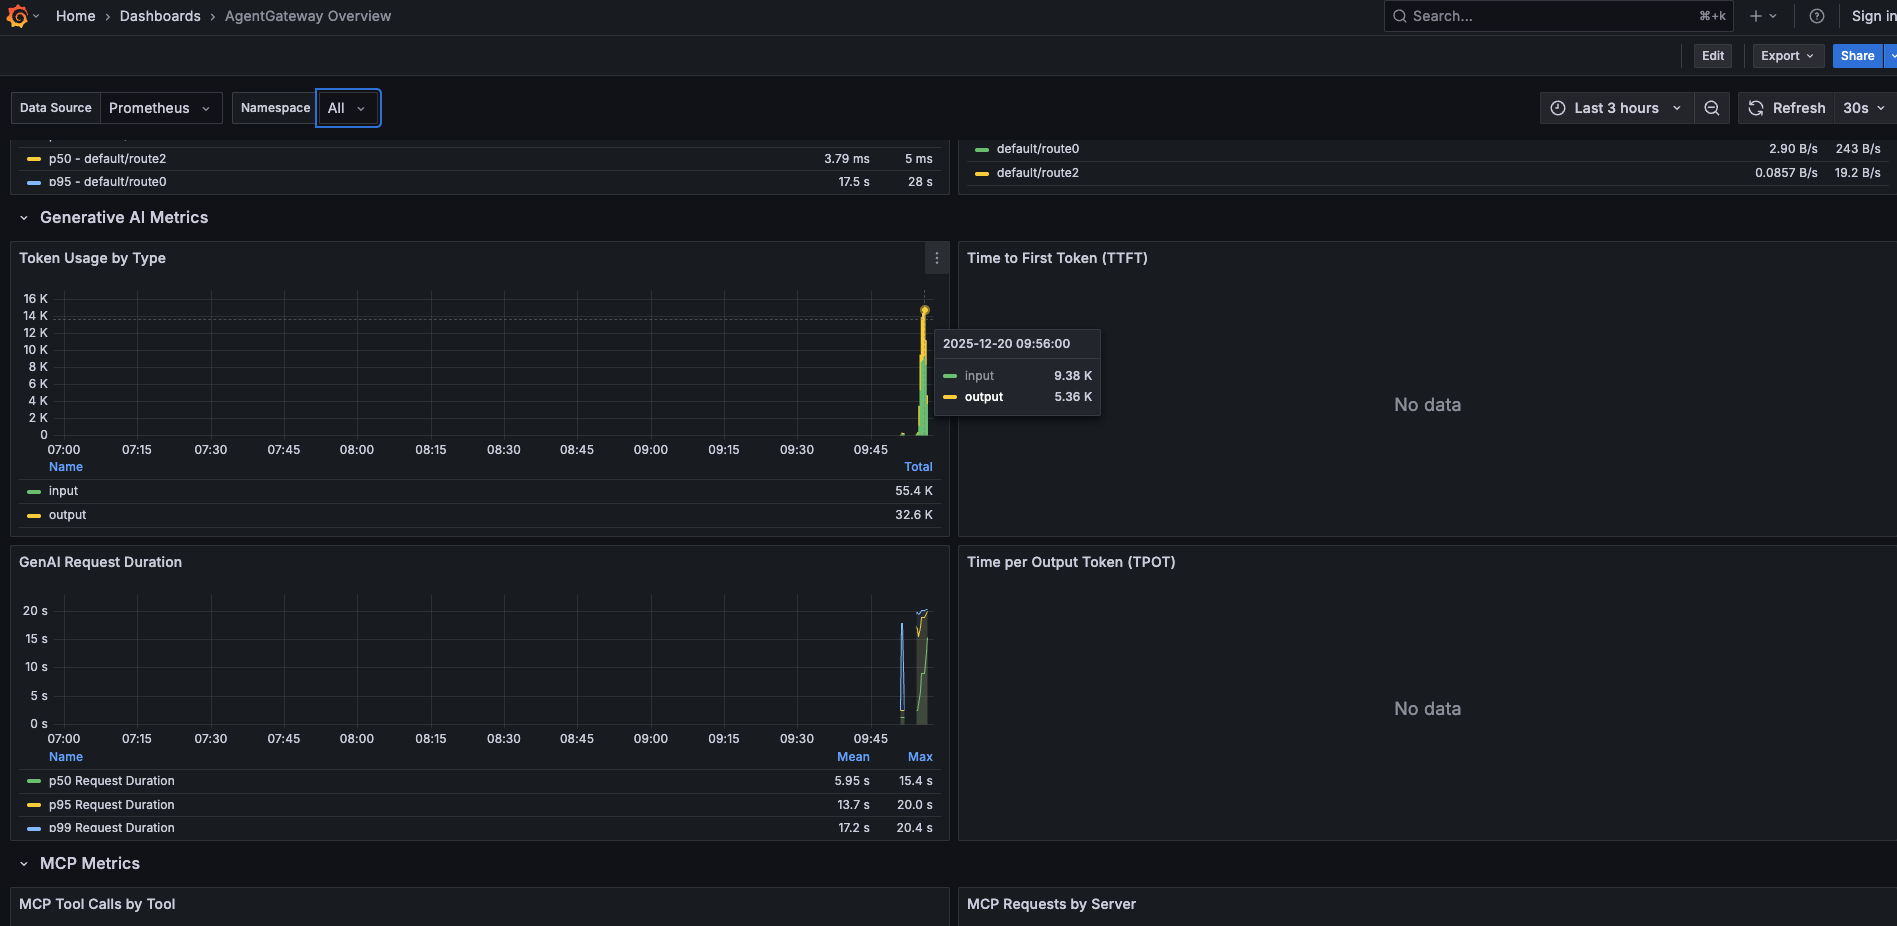
Generative AI Metrics
LLM/AI provider observability:
- Token Usage by Type - Input vs output token consumption
- Time to First Token (TTFT) - Streaming response latency to first token
- GenAI Request Duration - End-to-end AI request time
- Time per Output Token (TPOT) - Token generation throughput
MCP Metrics
Model Context Protocol monitoring:
- MCP Tool Calls by Tool - Request distribution across MCP tools
- MCP Requests by Server - Traffic by backend MCP server
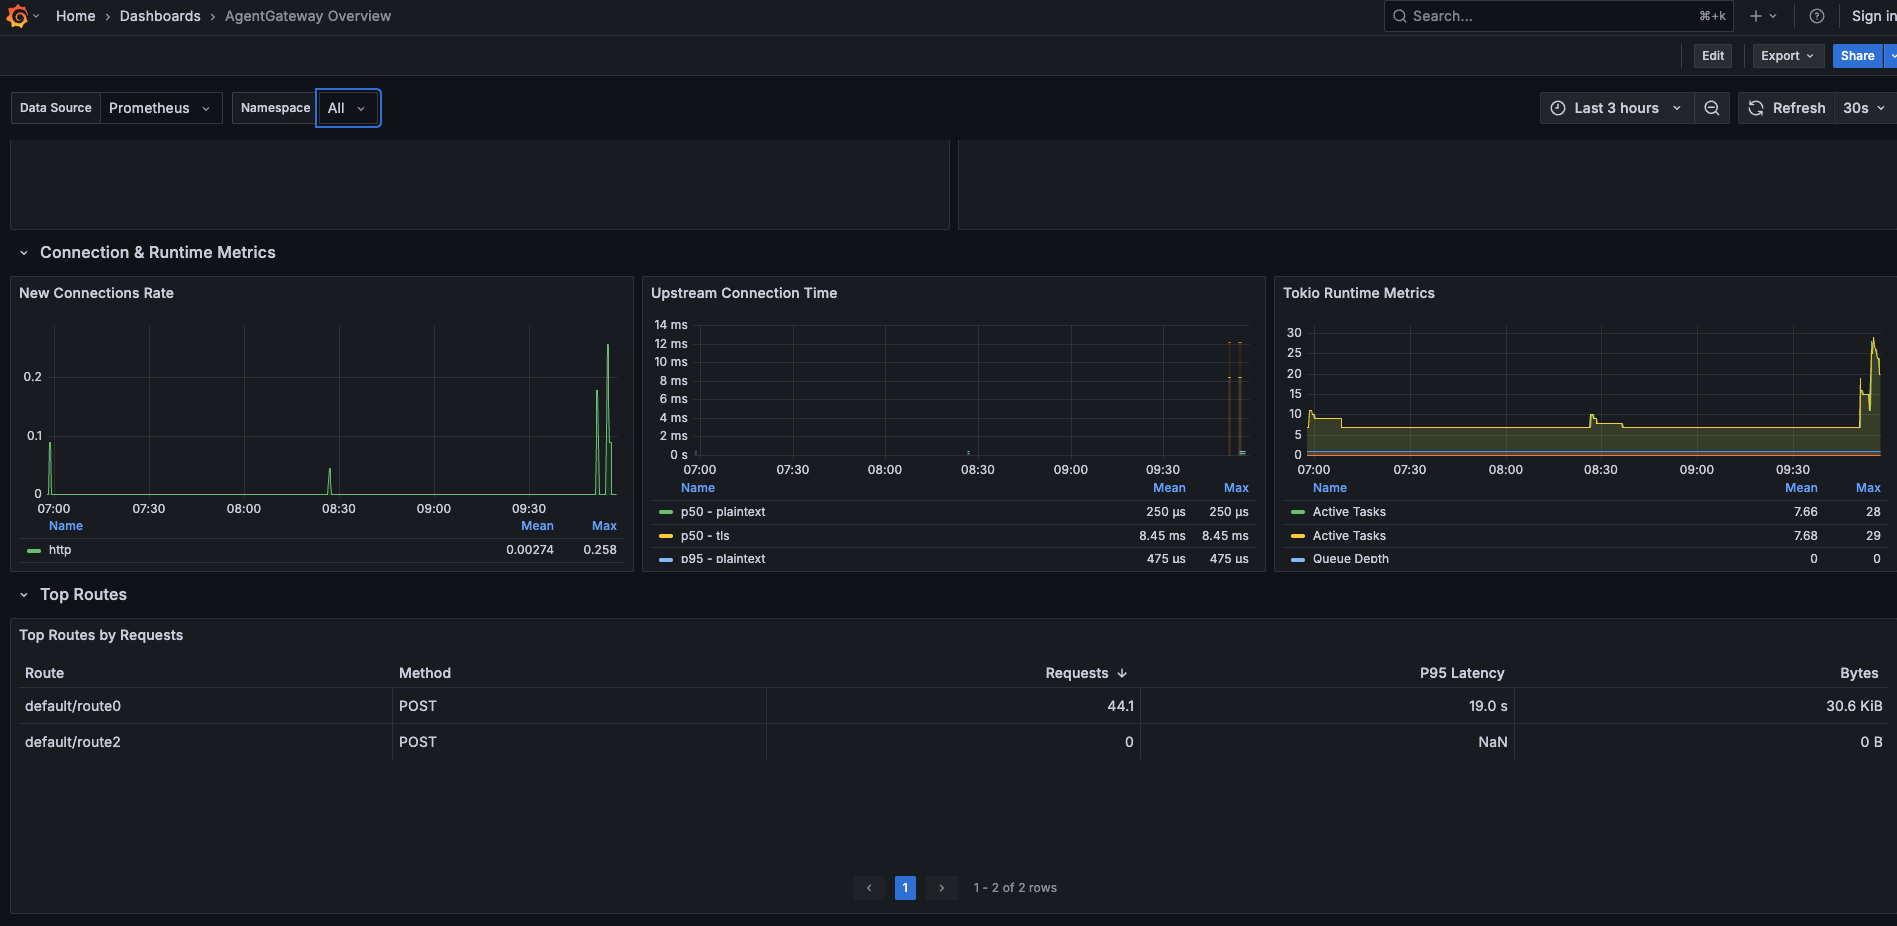
Connection & Runtime Metrics
Infrastructure health:
- New Connections Rate - Connection establishment rate
- Upstream Connection Time - Backend connection latency
- Tokio Runtime Metrics - Rust async runtime statistics
Top Routes
Traffic analysis table:
- Top Routes by Requests - Most frequently accessed endpoints
Requirements
- Grafana 9.0.0+
- Prometheus data source with AgentGateway metrics
Import Instructions
- Navigate to Grafana → Dashboards → Import
- Upload the JSON file / paste contents or use the dashboard ID
- Select your Prometheus data source
- Click Import
Data source config
Collector type:
Collector plugins:
Collector config:
Revisions
Upload an updated version of an exported dashboard.json file from Grafana
| Revision | Description | Created | |
|---|---|---|---|
| Download |