
Logging Dashboard via Loki v3
Universal and flexible dashboard for logging
Big update of https://grafana.com/grafana/dashboards/18042-logging-dashboard-via-loki-v2/
By default queries of variables and panels supposed that you have this loki labels (if not, you should change them in variables dashboard settings section or in json of dashboard to the similar what you have in loki):
- container_name — docker containers.
- service_name — batch of containers that can be distributed by a few nodes.
- instance — node hostname.
Features:
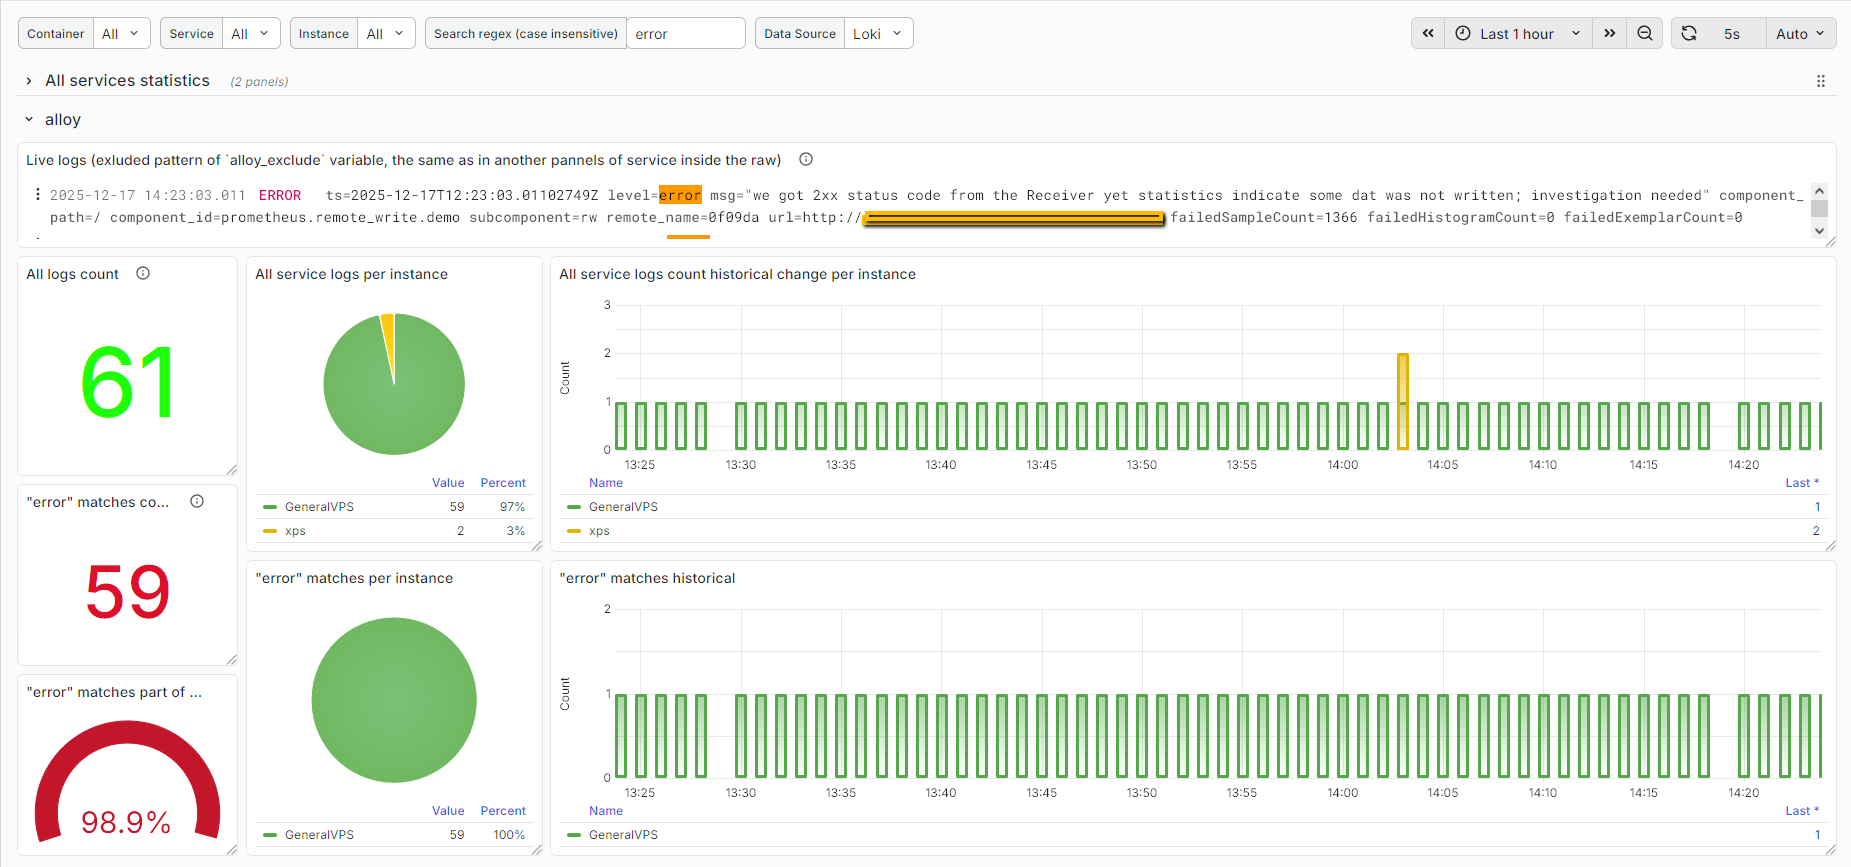
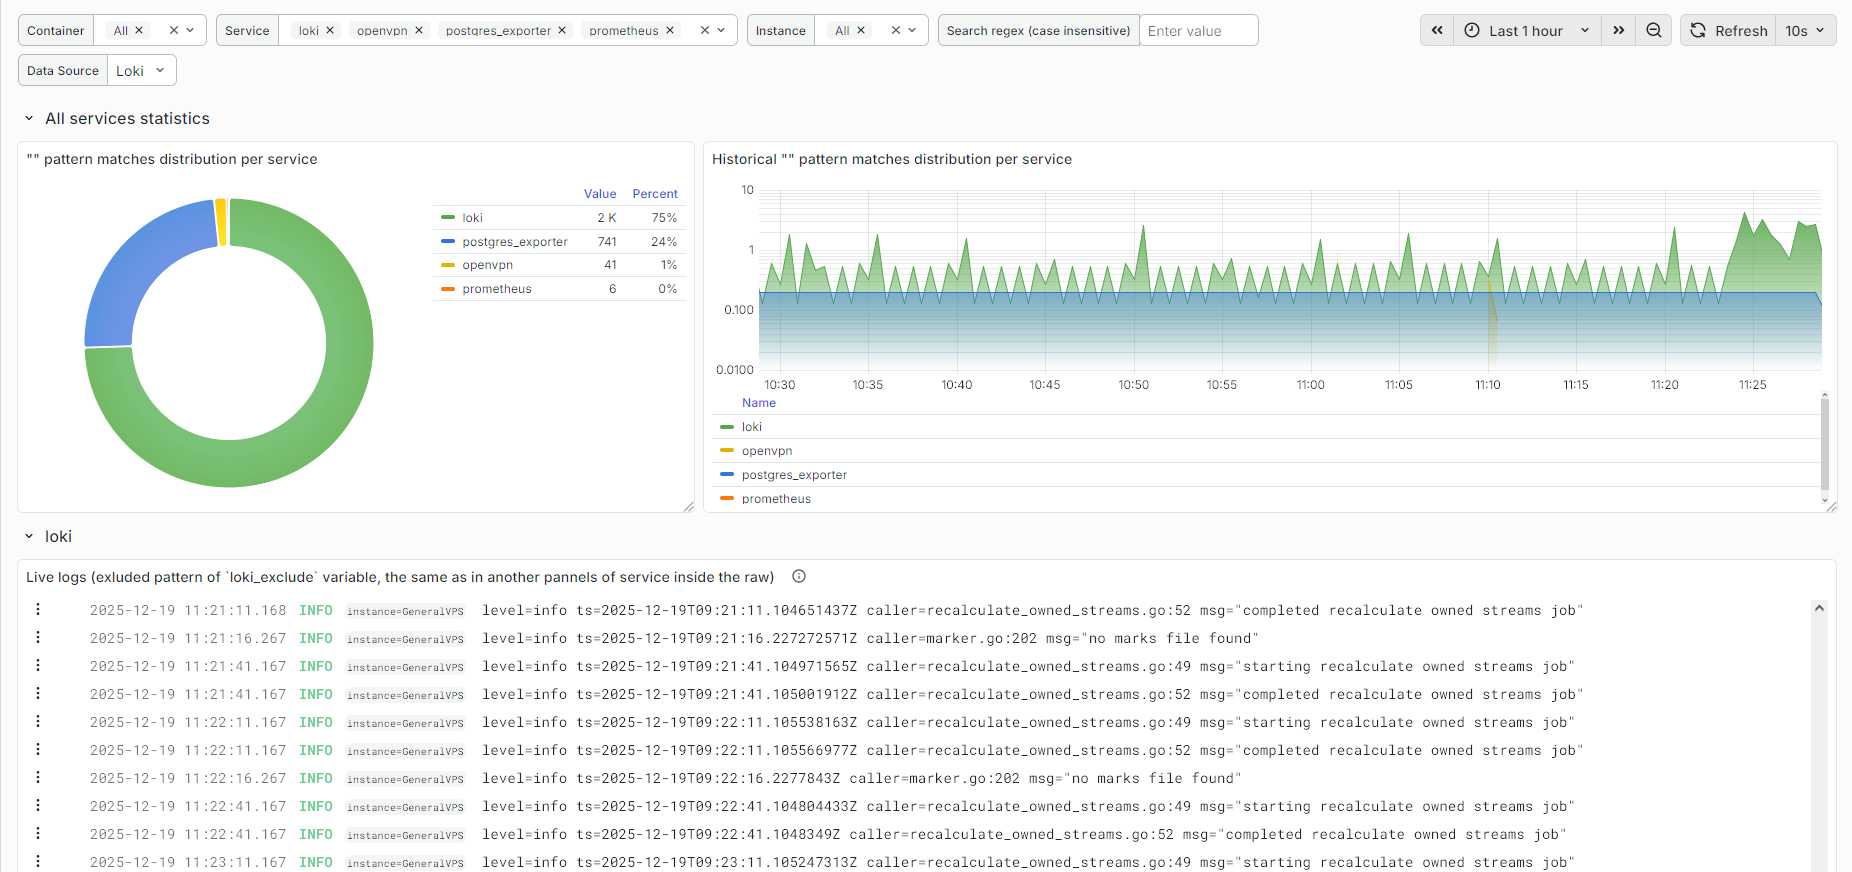
- Statistics of all services logs.
- Individual statistics per service. Each service automatically fetched from loki and panels are duplicated by raws. You can change the variable by which the distribution by raws happens and another pannels settings in the first raw.
- The regex pattern of a search defined as dynamic variable and common for all services on dashboard.
- The regex of persistent exclude from "${service_name}_exclude". For example prometheus_exclude, blackbox_exclude, yourapp_exclude. You should define them manually in Settings (of dashboard) → Variables. And it can't be empty. Just delete, if you don't need it.
- All variables support multiselect.
Usage tips:
- Queries can be heavy with a large infrastructure. And if autorefresh time is too small, then the data will not be displayed in any panel infinitely. To change it just increase the time of auto-refresh in the upper-right corner of dashboard.
- No data can be displayed just due to too small timerange that is near to auto-refresh button. Just increase it.
- Exclude pattern can not work below Grafana v12.3.1. Just update it then.
You are welcome to share your ideas or issues to a telegram that matches username here!
Data source config
Collector config:
Upload an updated version of an exported dashboard.json file from Grafana
| Revision | Description | Created | |
|---|---|---|---|
| Download |
Grafana Loki (self-hosted)
Easily monitor Grafana Loki (self-hosted), a horizontally scalable, highly available, multi-tenant log aggregation system inspired by Prometheus, with Grafana Cloud's out-of-the-box monitoring solution.
Learn more