
n8n System Health Overview
Monitor your n8n workflow automation platform with this comprehensive Node.js runtime and application health dashboard. Tracks CPU, memory, heap usage, garbage collection, event loop performance, and cluster status using n8n's native Prometheus metrics. https://github.com/nluecke/grafana-n8n-dashboards/tree/main/dashboards/prometheus
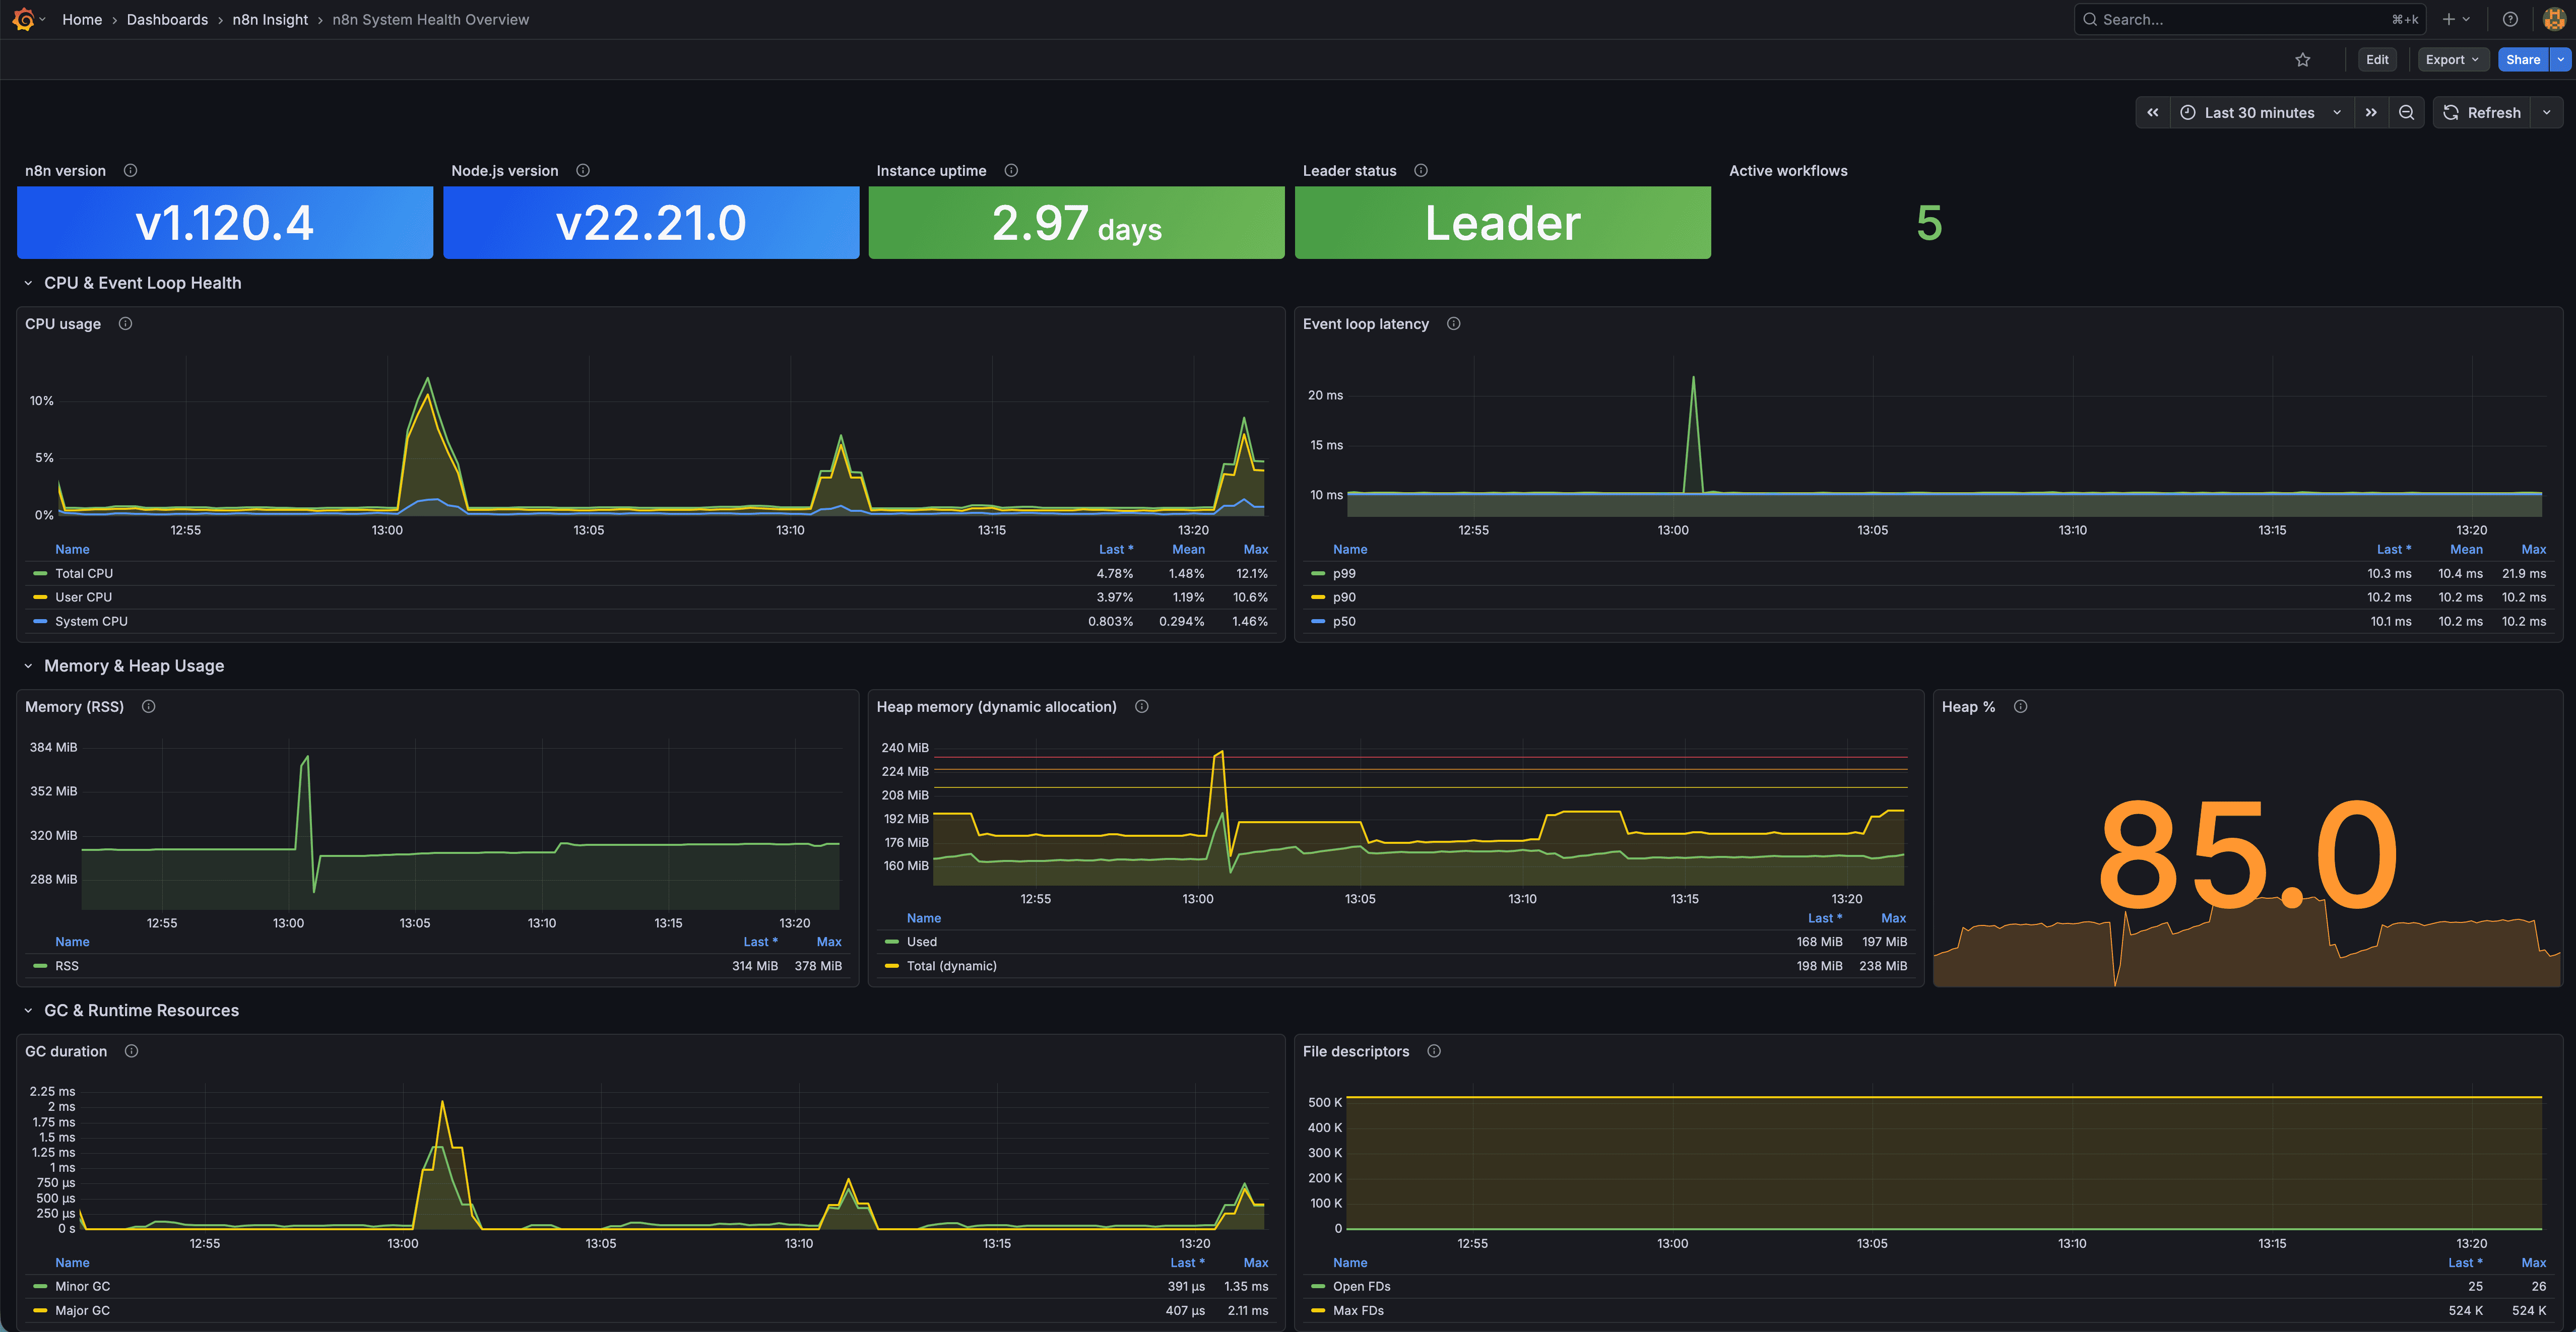
n8n System Health Overview Dashboard
A Grafana dashboard providing real-time observability into the n8n Node.js runtime, system resources, event loop health, memory usage, CPU load, and process stability via Prometheus.
Overview
This dashboard focuses on low-level system and runtime metrics from n8n’s Prometheus endpoint.
It gives production operators a clear view of instance health and performance.
Features
Process & Instance Information
- n8n version
- Node.js version
- Instance uptime (with thresholds)
- Leader/follower role (cluster)
- Active workflows
CPU & Event Loop Health
- CPU breakdown (total/user/system)
- Event loop latency percentiles (P50/P90/P99)
Memory & Heap Usage
- RSS memory usage
- Heap used vs total
- Heap usage percentage
Garbage Collection & Runtime
- GC duration by type
- Open file descriptors
- Max file descriptor limit
Requirements
Software
- Grafana ≥ 8
- Prometheus as datasource
- n8n instance with Prometheus metrics enabled
Enable n8n Metrics
Set:
N8N_METRICS=true
Prometheus Scrape Config
scrape_configs:
  - job_name: "n8n"
    static_configs:
      - targets: ["your-n8n-instance:5678"]
    metrics_path: "/metrics"
    scrape_interval: 15s
Installation
Option A: JSON Import
- Download
n8n-system-health-overview.json - Import at Dashboards → Import
- Select your Prometheus datasource
Option B: Grafana.com
- Dashboard ID: 24474
Metrics Used
| Metric | Description |
|---|---|
| n8n_version_info | n8n version |
| n8n_nodejs_version_info | Node.js version |
| n8n_process_start_time_seconds | Process start time |
| n8n_instance_role_leader | Leader status |
| n8n_active_workflow_count | Active workflows |
| n8n_process_cpu_seconds_total | Total CPU |
| n8n_process_cpu_user_seconds_total | User CPU |
| n8n_process_cpu_system_seconds_total | System CPU |
| n8n_nodejs_eventloop_lag_p*_seconds | Event loop percentiles |
| n8n_process_resident_memory_bytes | RSS memory |
| n8n_nodejs_heap_size_used_bytes | Heap used |
| n8n_nodejs_heap_size_total_bytes | Heap total |
| n8n_nodejs_gc_duration_seconds_sum | GC duration |
| n8n_process_open_fds | Open file descriptors |
| n8n_process_max_fds | Max file descriptors |
Notes
This dashboard is a system-level complement to the PostgreSQL workflow analytics dashboard.
Data source config
Collector config:
Upload an updated version of an exported dashboard.json file from Grafana
| Revision | Description | Created | |
|---|---|---|---|
| Download |