
Envoy / Upstream
Detailed upstream cluster monitoring for Envoy proxy. Tracks request rates, latency distributions (P50/P95/P99), success rates, connection health, circuit breaker status, retry behavior, and timeout patterns for each upstream cluster. Use this dashboard to troubleshoot backend service issues, identify performance bottlenecks, and monitor cluster health across all Envoy pods. Supports multi-cluster selection for comparative analysis. The dashboards were generated using [envoy-mixin](https://github.com/adinhodovic/envoy-mixin). Open issues and create feature requests in the repository.
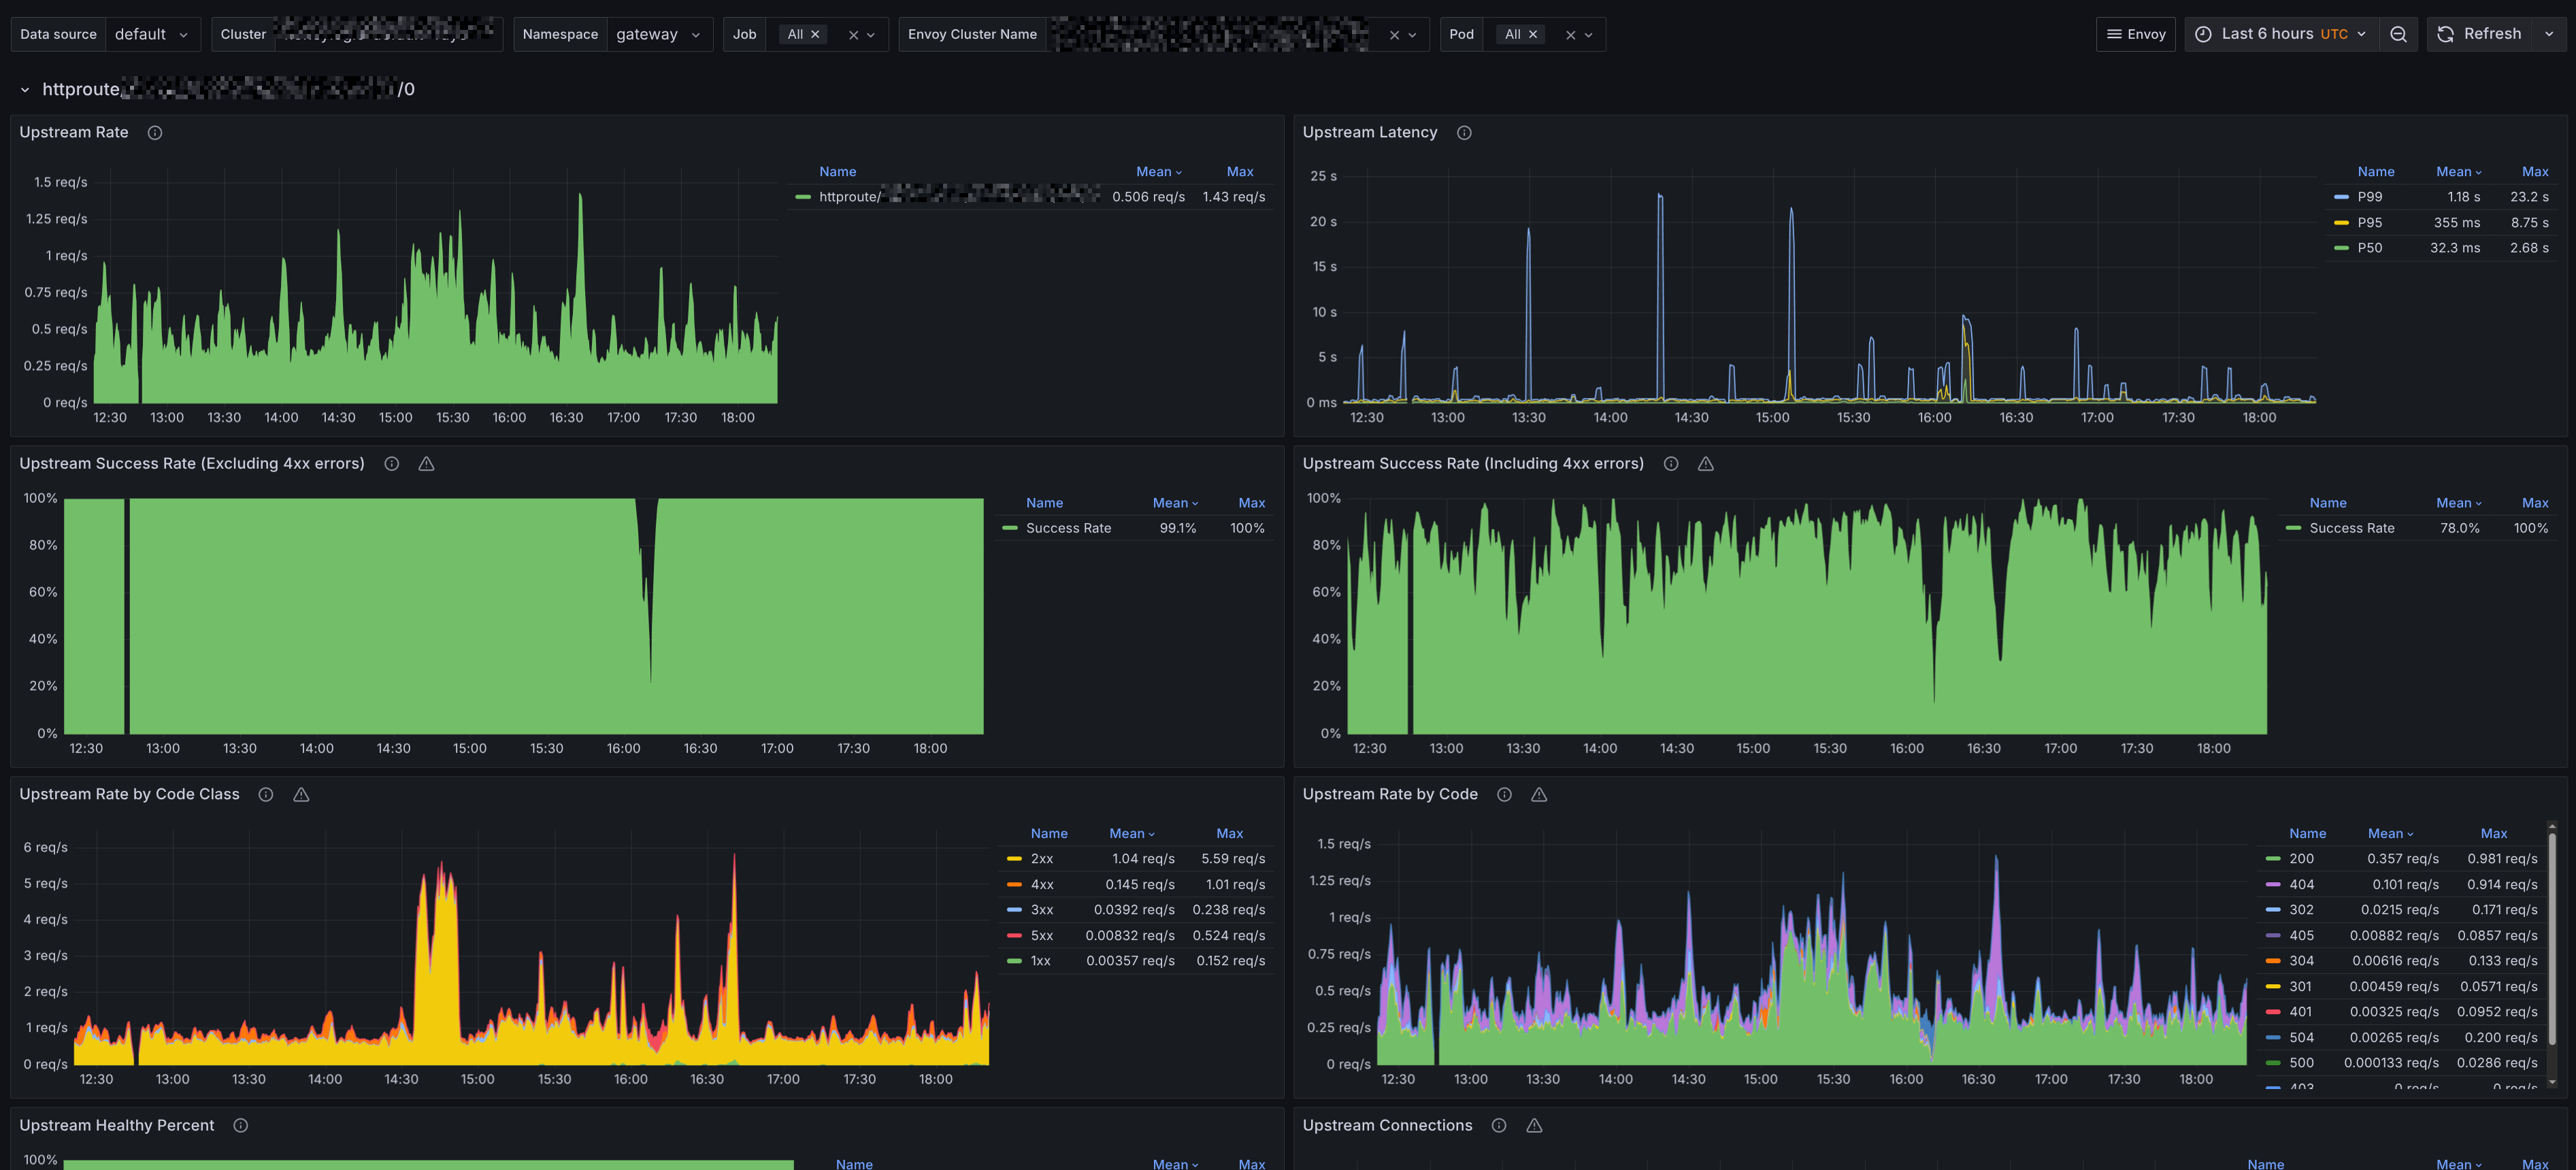
A dashboard that monitors Envoy with a focus on giving an upstreams. The dashboards were generated using envoy-mixin. Open issues and create feature requests in the repository.
Data source config
Collector config:
Upload an updated version of an exported dashboard.json file from Grafana
| Revision | Description | Created | |
|---|---|---|---|
| Download |
Envoy
Easily monitor Envoy, an open source edge and service proxy, designed for cloud-native applications, with Grafana Cloud's out-of-the-box monitoring solution.
Learn more