
NodeJS Observability
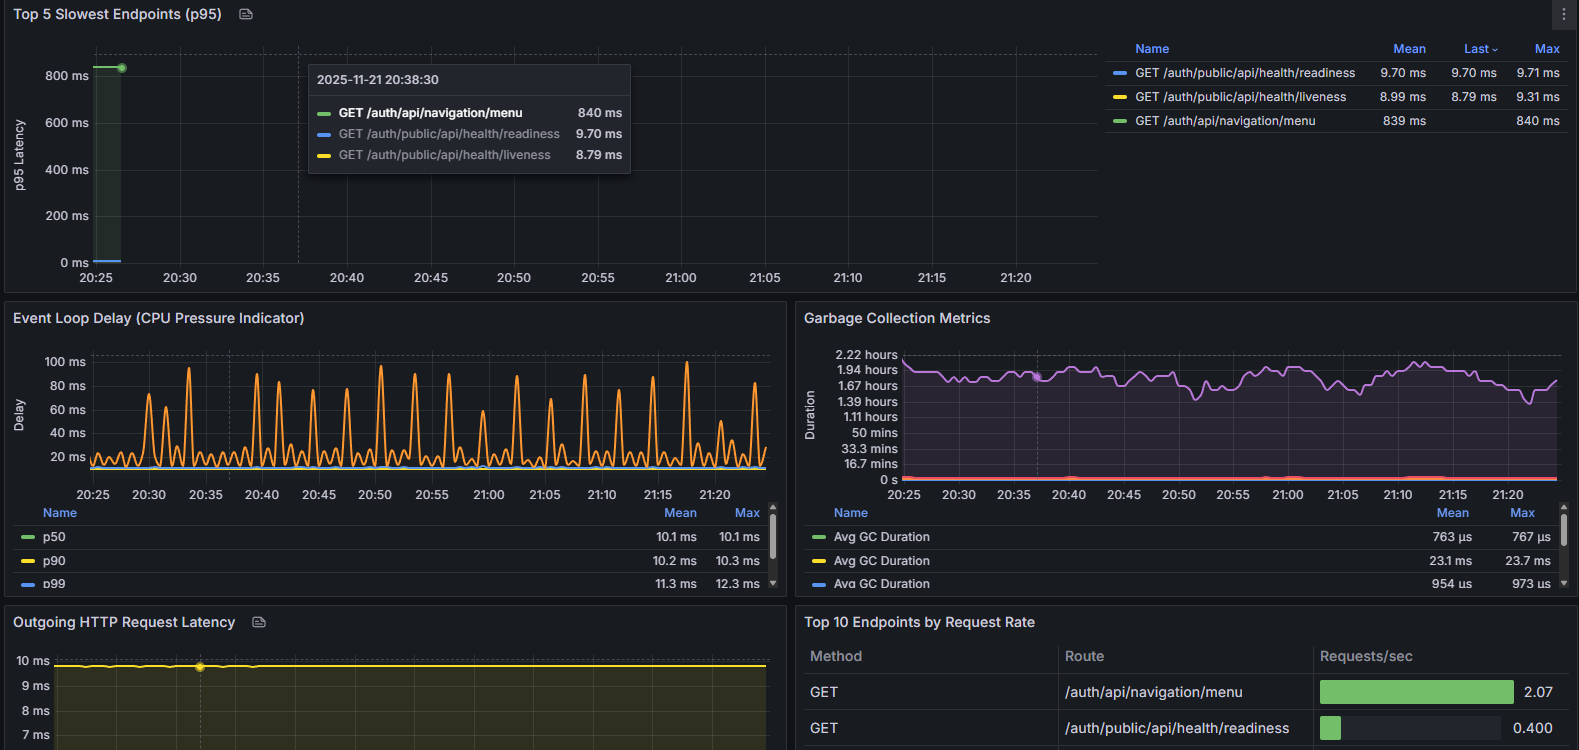
Comprehensive observability dashboard for Node.js applications with full telemetry support. Includes logs (Loki), metrics (Prometheus/Mimir), continuous profiling (Pyroscope), and distributed tracing (Tempo). Monitor application performance, identify bottlenecks, and troubleshoot issues with real-time insights into heap memory, event loop utilization, HTTP latency percentiles, garbage collection, and service dependencies.
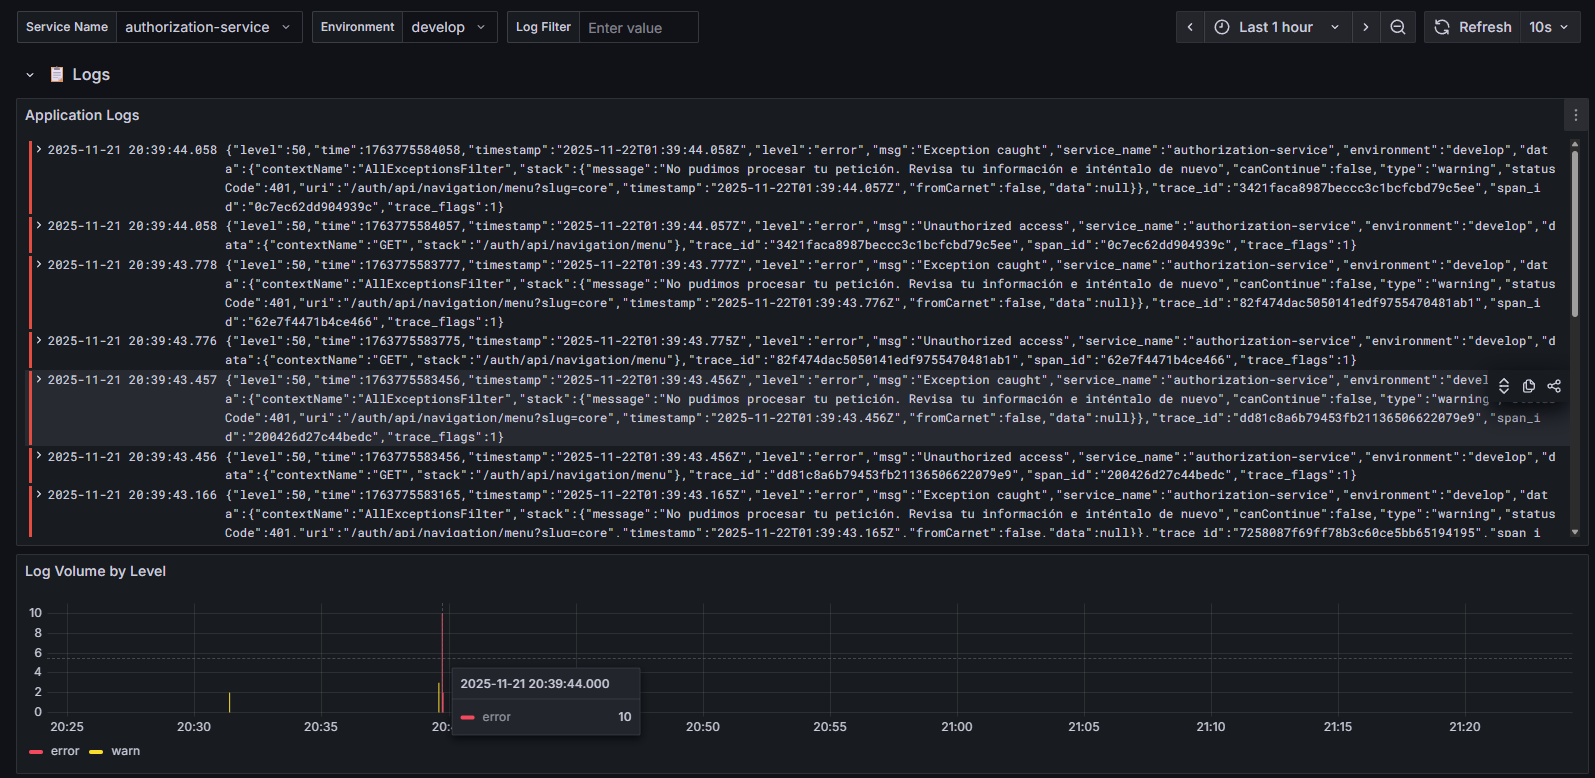
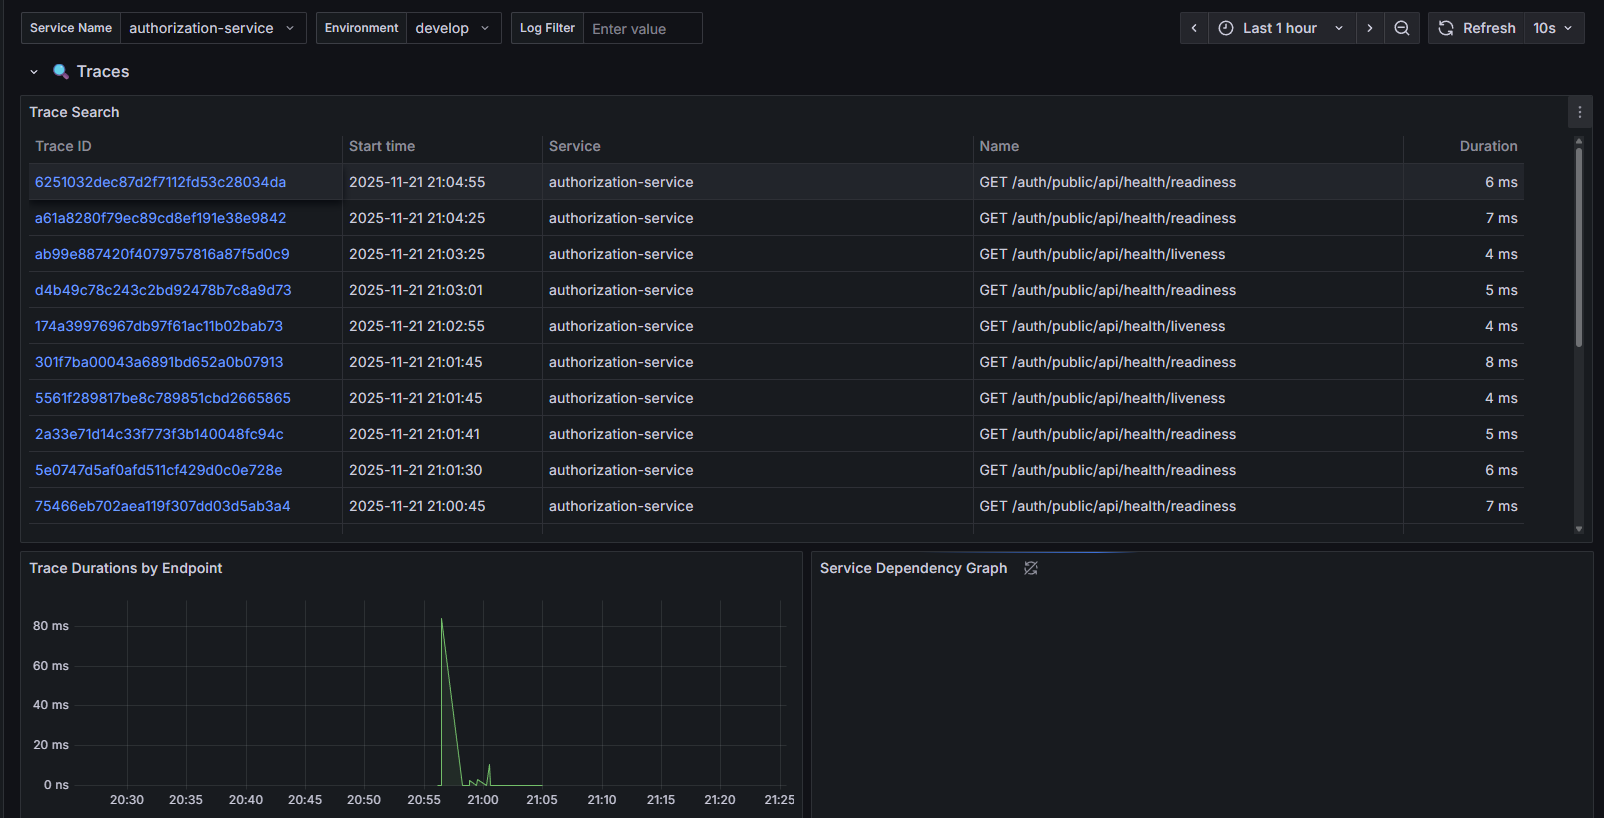
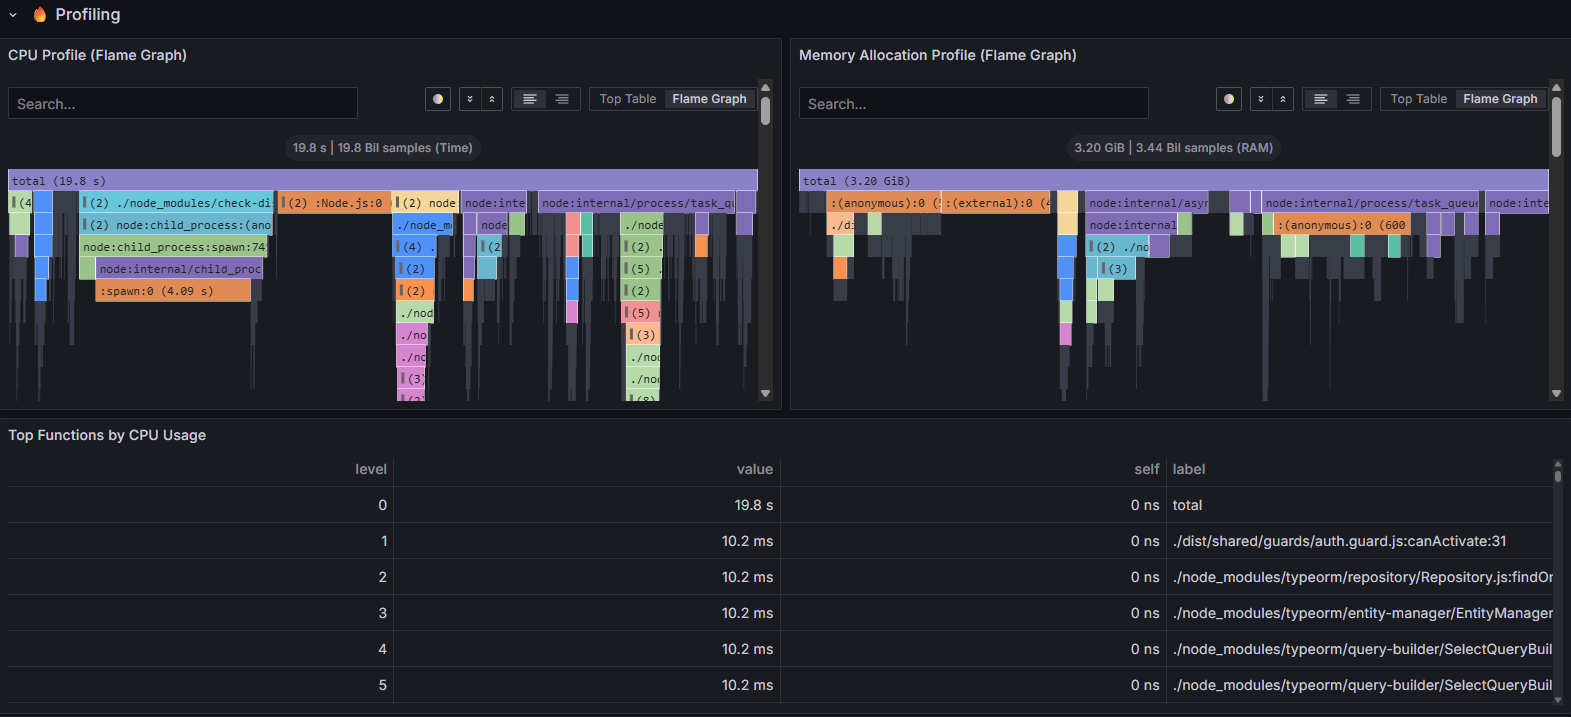
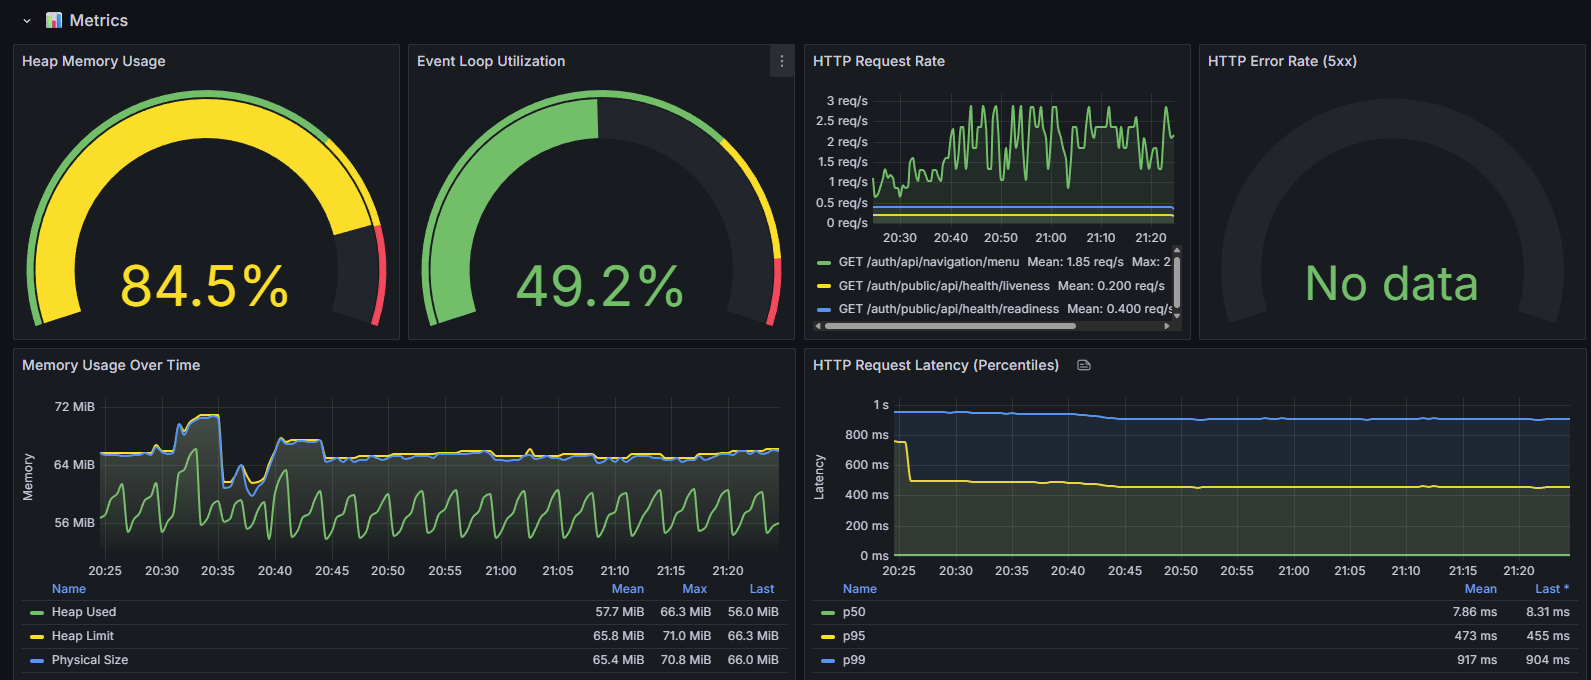
The NodeJS Observability dashboard uses the grafana-pyroscope-datasource, loki, prometheus and tempo data sources to create a Grafana dashboard with the flamegraph, gauge, logs, nodeGraph, table and timeseries panels.
Data source config
Collector type:
Collector plugins:
Collector config:
Revisions
Upload an updated version of an exported dashboard.json file from Grafana
| Revision | Description | Created | |
|---|---|---|---|
| Download |
Node.js
Easily monitor your deployment of Node.js, the open source JavaScript runtime, with Grafana Cloud's out-of-the-box monitoring solution.
Learn more