
OKache monitor dashboard
Comprehensive monitoring dashboard for OKache monitors. Features real-time status indicators, response time metrics, availability tracking, and historical analysis. Includes project and monitor filtering with customizable datasource selection.
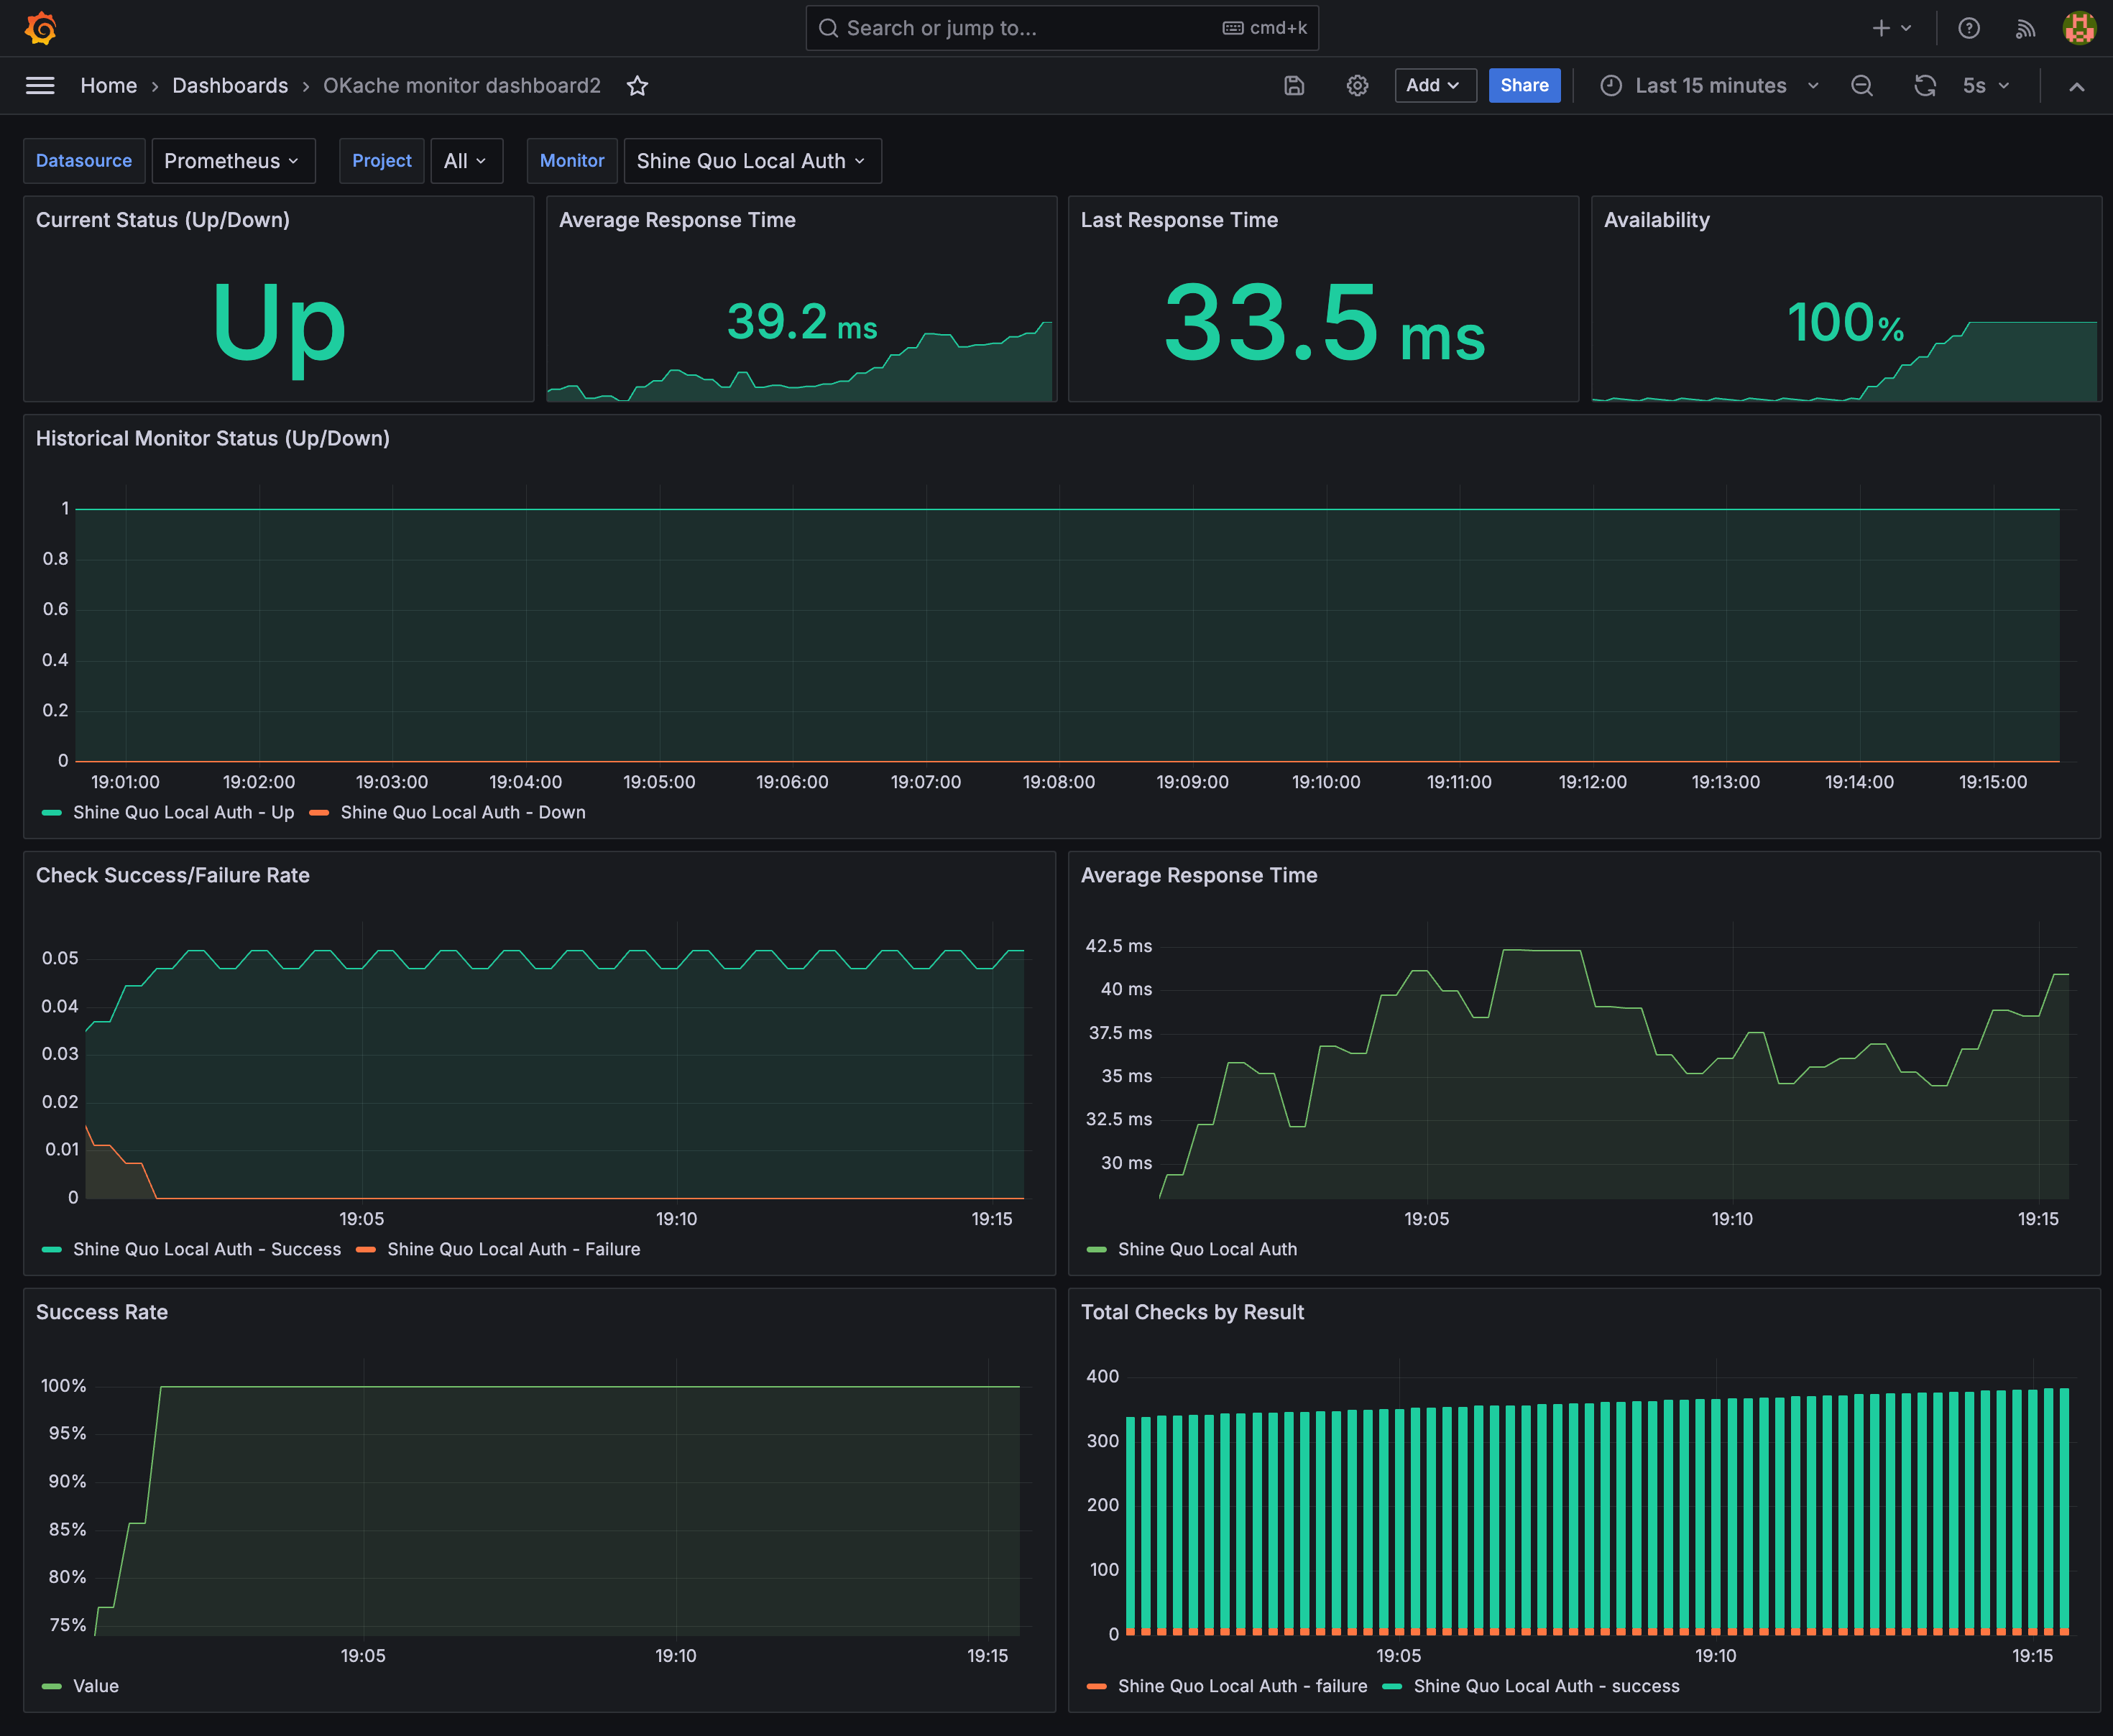
The OKache monitor dashboard dashboard uses the prometheus data source to create a Grafana dashboard with the stat and timeseries panels.
Data source config
Collector type:
Collector plugins:
Collector config:
Revisions
Upload an updated version of an exported dashboard.json file from Grafana
| Revision | Description | Created | |
|---|---|---|---|
| Download |