
Hedgehog Fabric
Fabric underlay connection monitoring. This dashboard shows the status of the BGP sessions inside the fabric. https://hedgehog.cloud
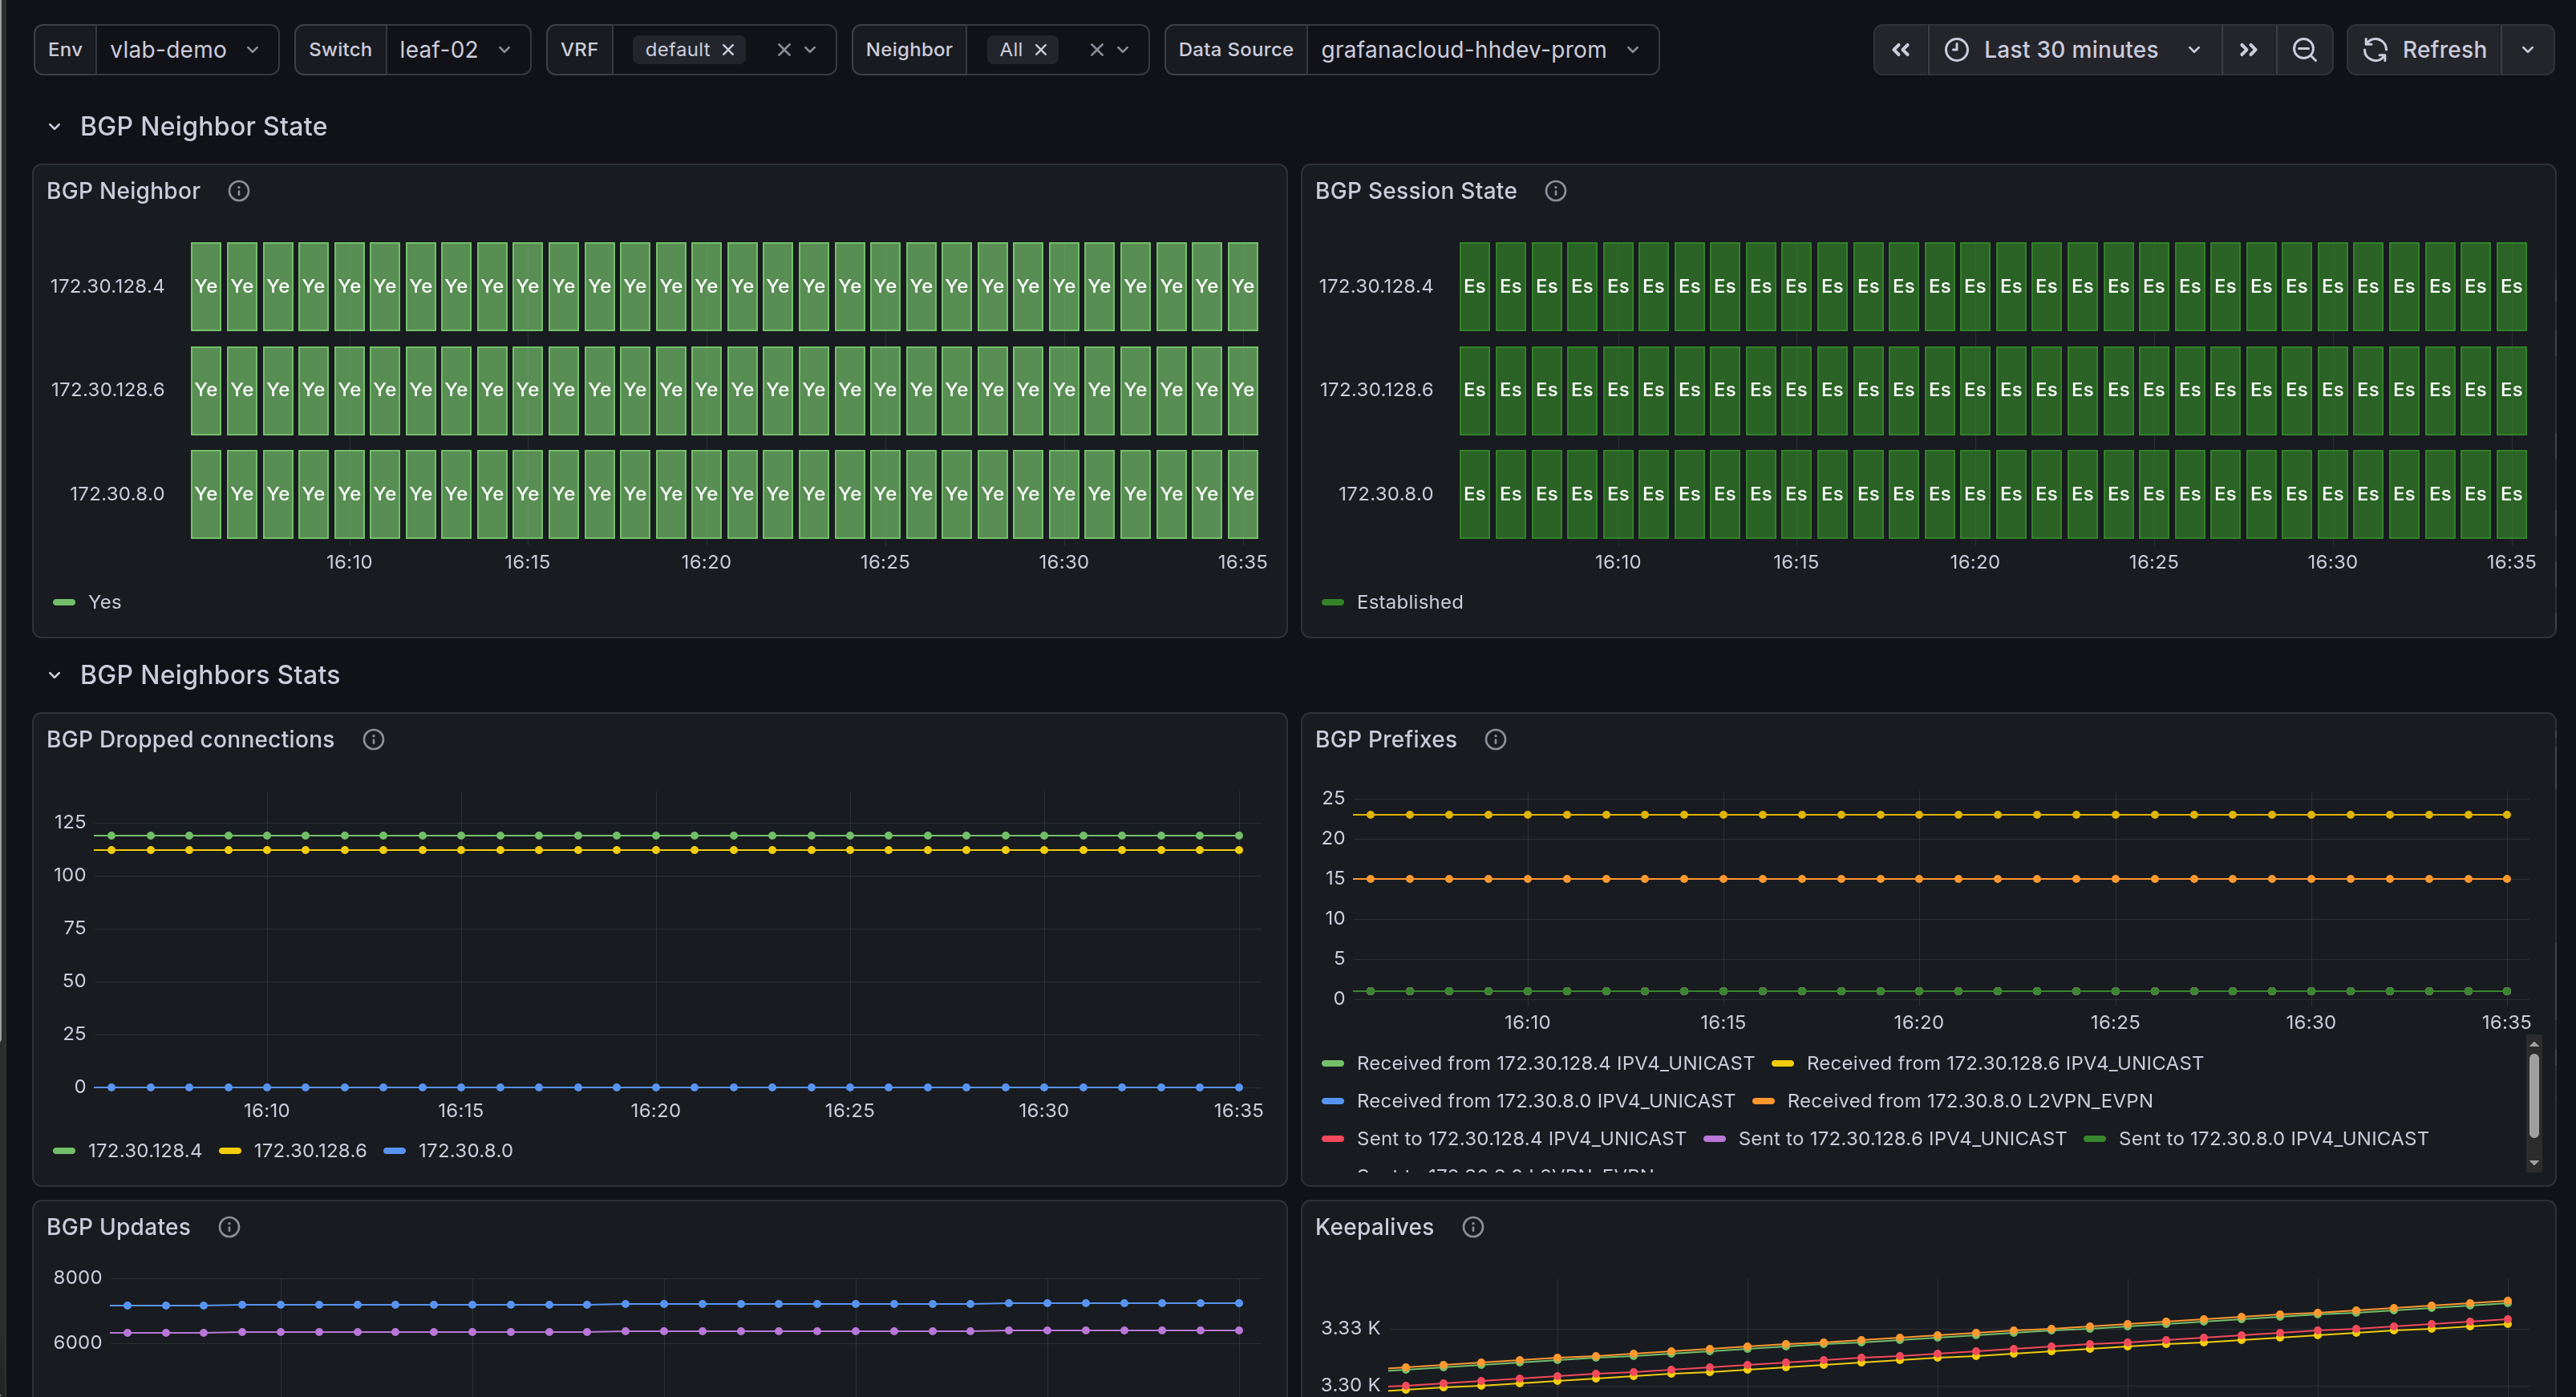
The Hedgehog Fabric dashboard uses the prometheus data source to create a Grafana dashboard with the status-history and timeseries panels.
Data source config
Collector type:
Collector plugins:
Collector config:
Revisions
Upload an updated version of an exported dashboard.json file from Grafana
| Revision | Description | Created | |
|---|---|---|---|
| Download |