
Hedgehog Agent Stats
This dashboard shows the status of the Agent on the switches, hearbeats, version, and configuration. The Hedgehog fabric runs on SONiC switches providing virtual private clouds (VPCs) managed by k8s APIs. Great for multi-tenancy and AI Networking
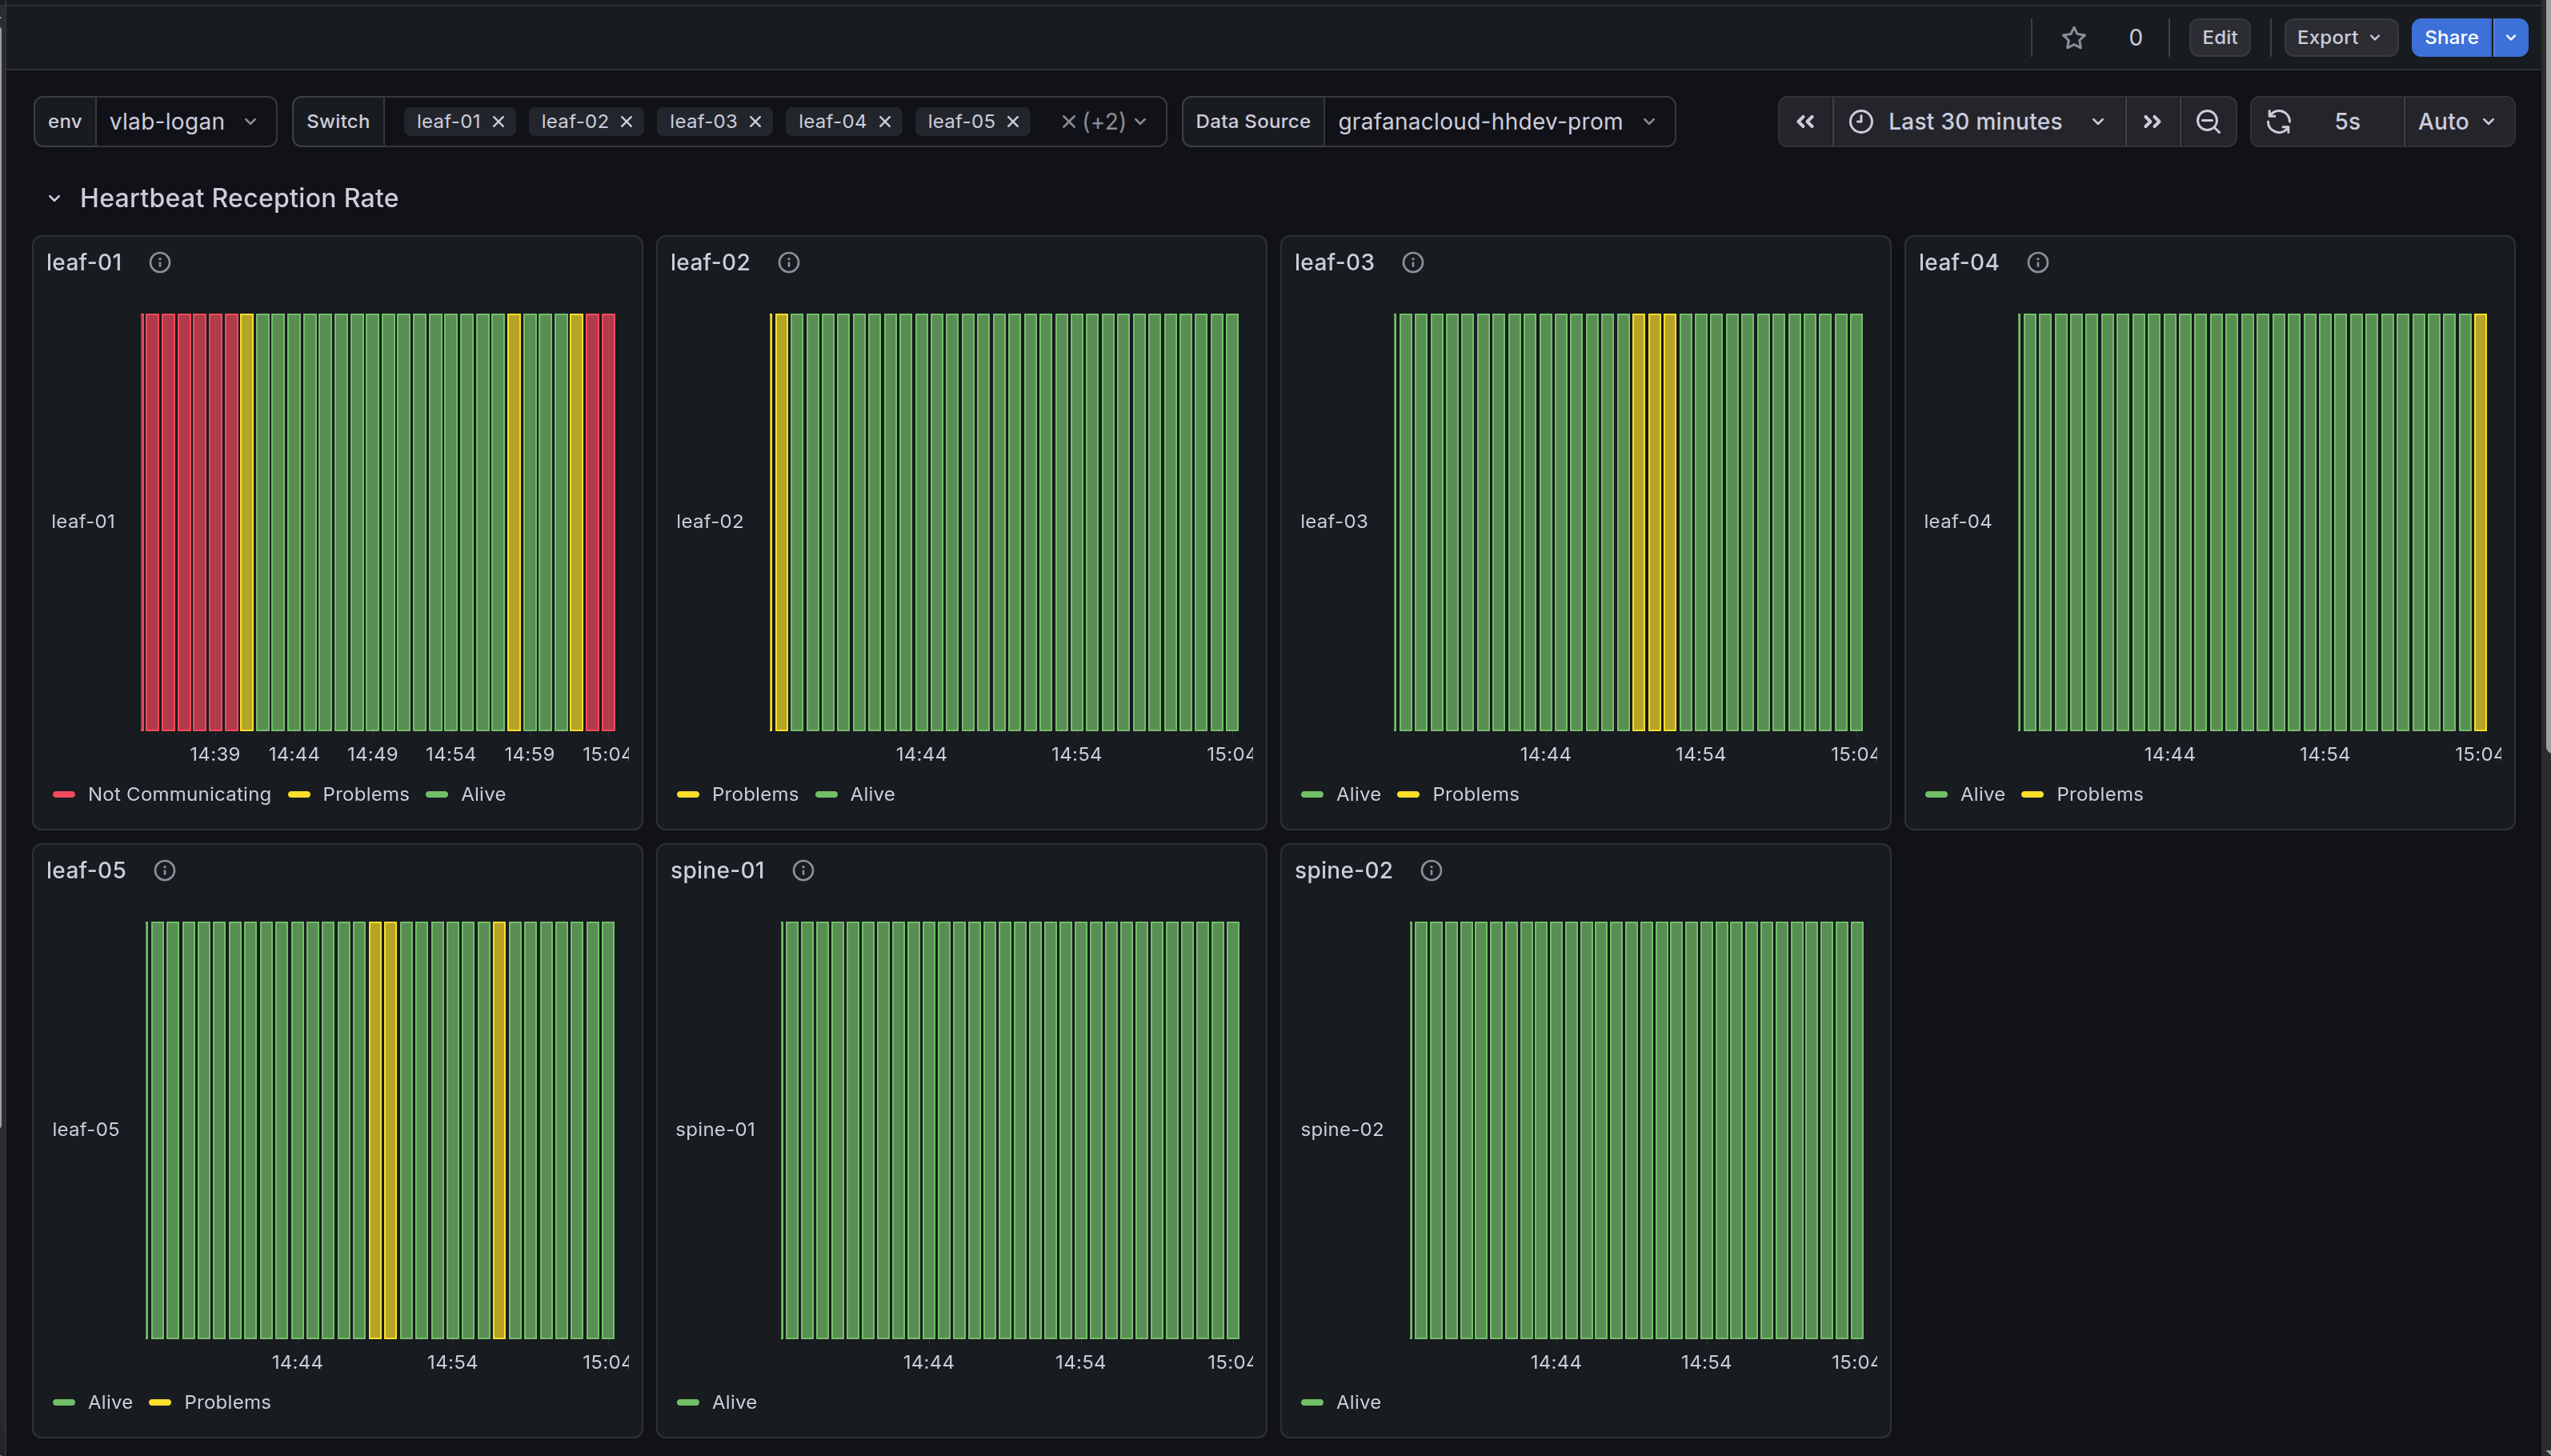
The Hedgehog Agent Stats dashboard uses the prometheus data source to create a Grafana dashboard with the stat and status-history panels.
Data source config
Collector type:
Collector plugins:
Collector config:
Revisions
Upload an updated version of an exported dashboard.json file from Grafana
| Revision | Description | Created | |
|---|---|---|---|
| Download |
Grafana Agent
Easily monitor metrics and logs from a Grafana Agent instance with Grafana Cloud's out-of-the-box monitoring solution.
Learn more