
DigiCloneMCP — Server Tools & Readiness
Prometheus-powered dashboard to monitor the DigiCloneMCP Server: readiness, tool throughput (QPS), and latency percentiles.
DigiCloneMCP — Server Tools & Readiness
Prometheus-powered dashboard to monitor the DigiCloneMCP server: readiness, tool throughput (QPS), and latency percentiles.
Overview
- Grafana: 12.2.0+
- Datasource: Prometheus
- Default range: 1h
- Refresh: 30m
- Title:
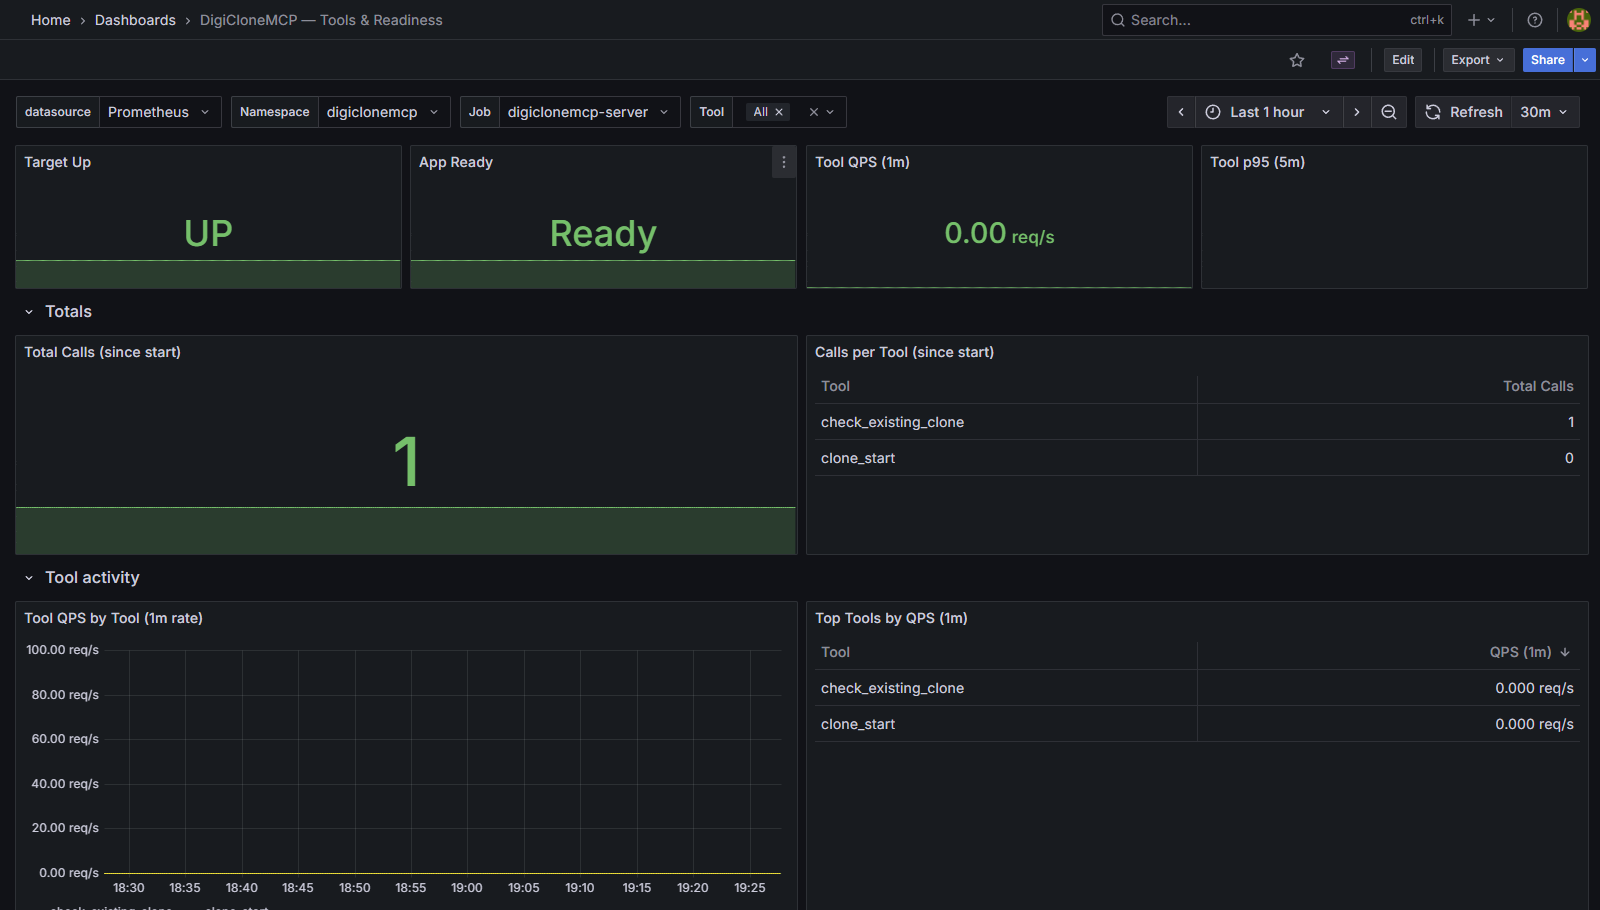
DigiCloneMCP — Tools & Readiness
Panels
Health
- Target Up →
up - App Ready →
app_ready
Throughput
- Tool QPS (1m) →
rate(mcp_tool_calls_total[1m]) - Total Calls (since start) →
sum(mcp_tool_calls_total) - Top Tools (QPS 1m) →
topk(10, rate(mcp_tool_calls_total[1m]))
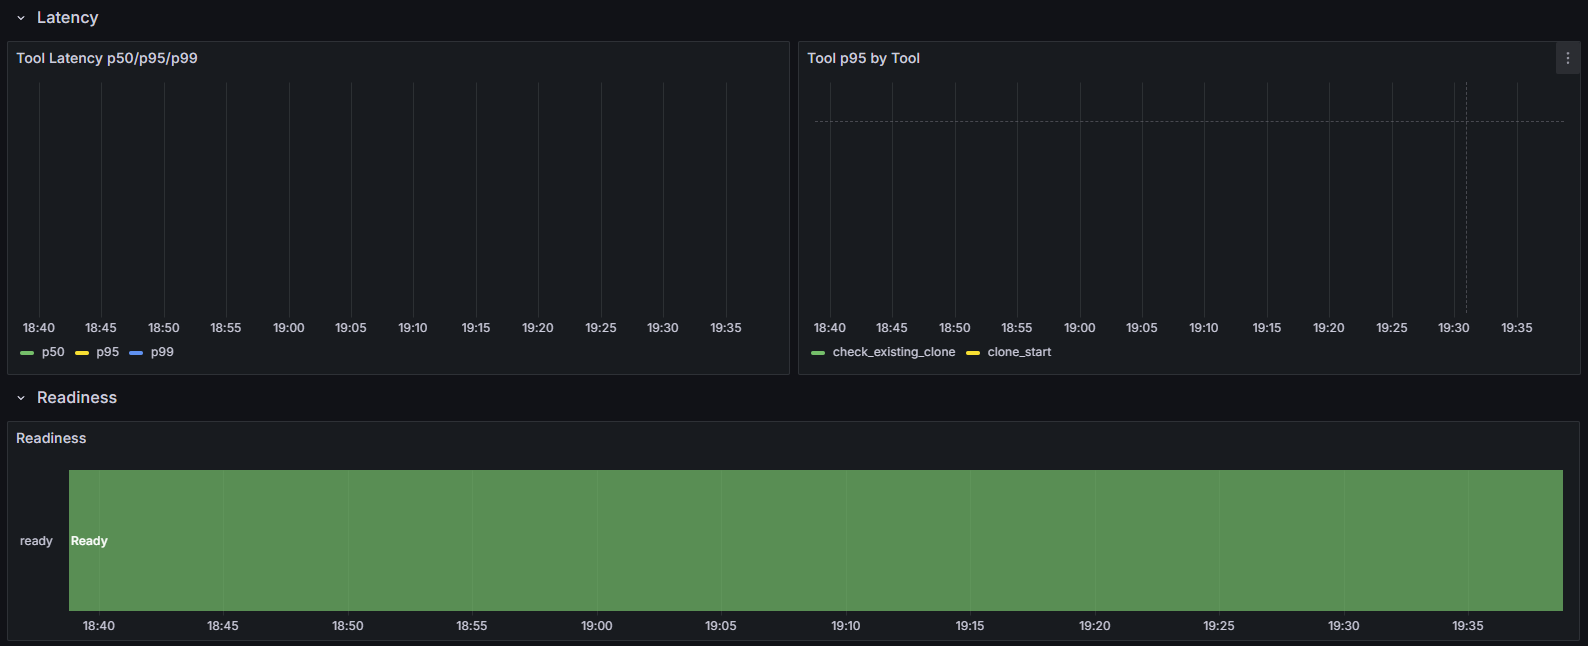
Latency
- p50/p95/p99 (5m) →
histogram_quantile(<q>, sum by (le) (rate(mcp_tool_duration_seconds_bucket[5m]))) - p95 by Tool (5m) →
histogram_quantile(0.95, sum by (le, tool) (rate(mcp_tool_duration_seconds_bucket[5m])))
Readiness Timeline
- App Ready over time →
app_ready
Variables
datasource: Prometheus sourcenamespace:label_values(app_ready, namespace)job:label_values(app_ready{namespace="$namespace"}, job)tool(multi):label_values(mcp_tool_calls_total{namespace="$namespace", job=~"$job"}, tool)
Key Queries
- Target Up:
max(up{job=~"$job", namespace="$namespace"}) - App Ready:
max(app_ready{job=~"$job", namespace="$namespace"}) - Tool QPS (1m):
sum(rate(mcp_tool_calls_total{job=~"$job", namespace="$namespace", tool=~"$tool"}[1m])) - Latency p95 (5m):
histogram_quantile(0.95, sum by (le) (rate(mcp_tool_duration_seconds_bucket{job=~"$job", namespace="$namespace"}[5m]))) - p95 by Tool (5m):
histogram_quantile(0.95, sum by (le, tool) (rate(mcp_tool_duration_seconds_bucket{job=~"$job", namespace="$namespace", tool=~"$tool"}[5m])))
Import
Upload JSON
- Dashboards → New → Import
- Upload the JSON and choose your Prometheus datasource for
DS_PROMETHEUS
Grafana Labs ID
- After publishing, you can import by ID directly.
Requirements
- DigiCloneMCP server must expose:
upapp_readymcp_tool_calls_totalmcp_tool_duration_seconds_bucket
- Metrics should include labels:
namespace,job,tool
Usage
- Select
namespaceandjobfor the DigiCloneMCP server. - Keep
tool = Allfor aggregate view or pick tools to drill down. - Watch:
- Up/Ready for quick health
- QPS for throughput
- Latency percentiles for slowdowns
- Readiness timeline for flaps
- For live ops, set refresh to
30s–2m.
Data source config
Collector type:
Collector plugins:
Collector config:
Revisions
Upload an updated version of an exported dashboard.json file from Grafana
| Revision | Description | Created | |
|---|---|---|---|
| Download |