
Elastic Cloud Dashboard
Prometheus Elasticsearch Exporter with preconfigured dashboards.
Overview
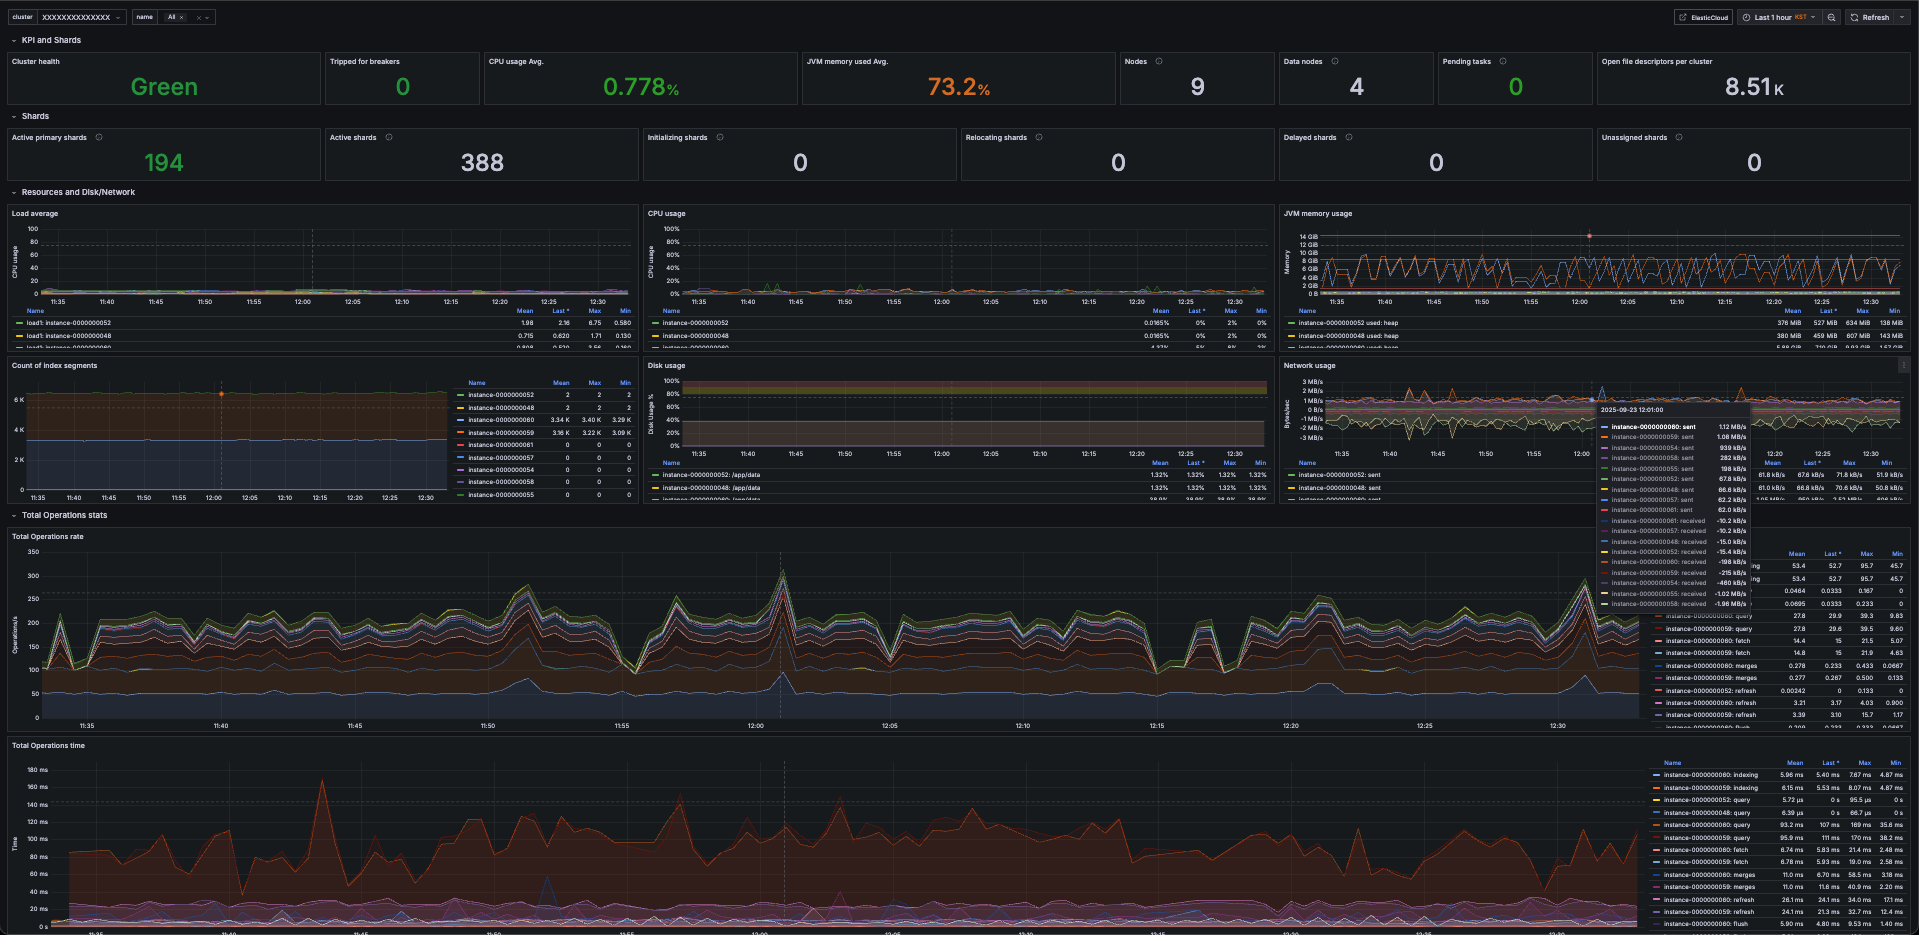
This dashboard uses elasticsearch-exporter to collect metrics from Elastic Cloud or self-hosted Elasticsearch clusters. It enables real-time visibility into search performance, cluster health, and resource utilization.
Features
Cluster health: status, active nodes, unassigned shards
Index metrics: search/query latency, indexing throughput, request errors
Node metrics: CPU, memory, JVM heap usage, GC activity
Alerts for shard imbalance and high error rates
Requirements
Running elasticsearch-exporter (Prometheus exporter for Elasticsearch)
Prometheus data source configured in Grafana
Network access from exporter to Elastic Cloud endpoint (with authentication)
Usage
Deploy elasticsearch-exporter with your Elastic Cloud endpoint and credentials.
Configure Prometheus to scrape the exporter.
Import this dashboard JSON into Grafana.
Data source config
Collector config:
Upload an updated version of an exported dashboard.json file from Grafana
| Revision | Description | Created | |
|---|---|---|---|
| Download |