
k6 Application Metrics
Visualize k6 OSS results stored and application in Prometheus
Here’s an improved English version of the dashboard description, incorporating your enhancements and referencing the official k6 Prometheus dashboard (Grafana ID 19665) for context. You can use this in Grafana’s dashboard “Description” or in docs/blogs.
Enhanced k6 Prometheus Dashboard
This dashboard is based on the official k6 Prometheus Dashboard (Grafana ID 19665) provided by the Grafana k6 maintainers. It is designed to visualize k6 test result metrics stored in Prometheus when using the Prometheus Remote Write output option. Use this version if you have not exported the k6 trend metrics as native histograms. If you do use native histograms, refer to the k6 Prometheus (Native Histograms) Dashboard instead. Contributions via feature requests, bug reports, or pull requests are welcome; the source is available on GitHub.
What’s New / Enhanced Features
To better align performance testing with actual service health and reliability, this version introduces several improvements:
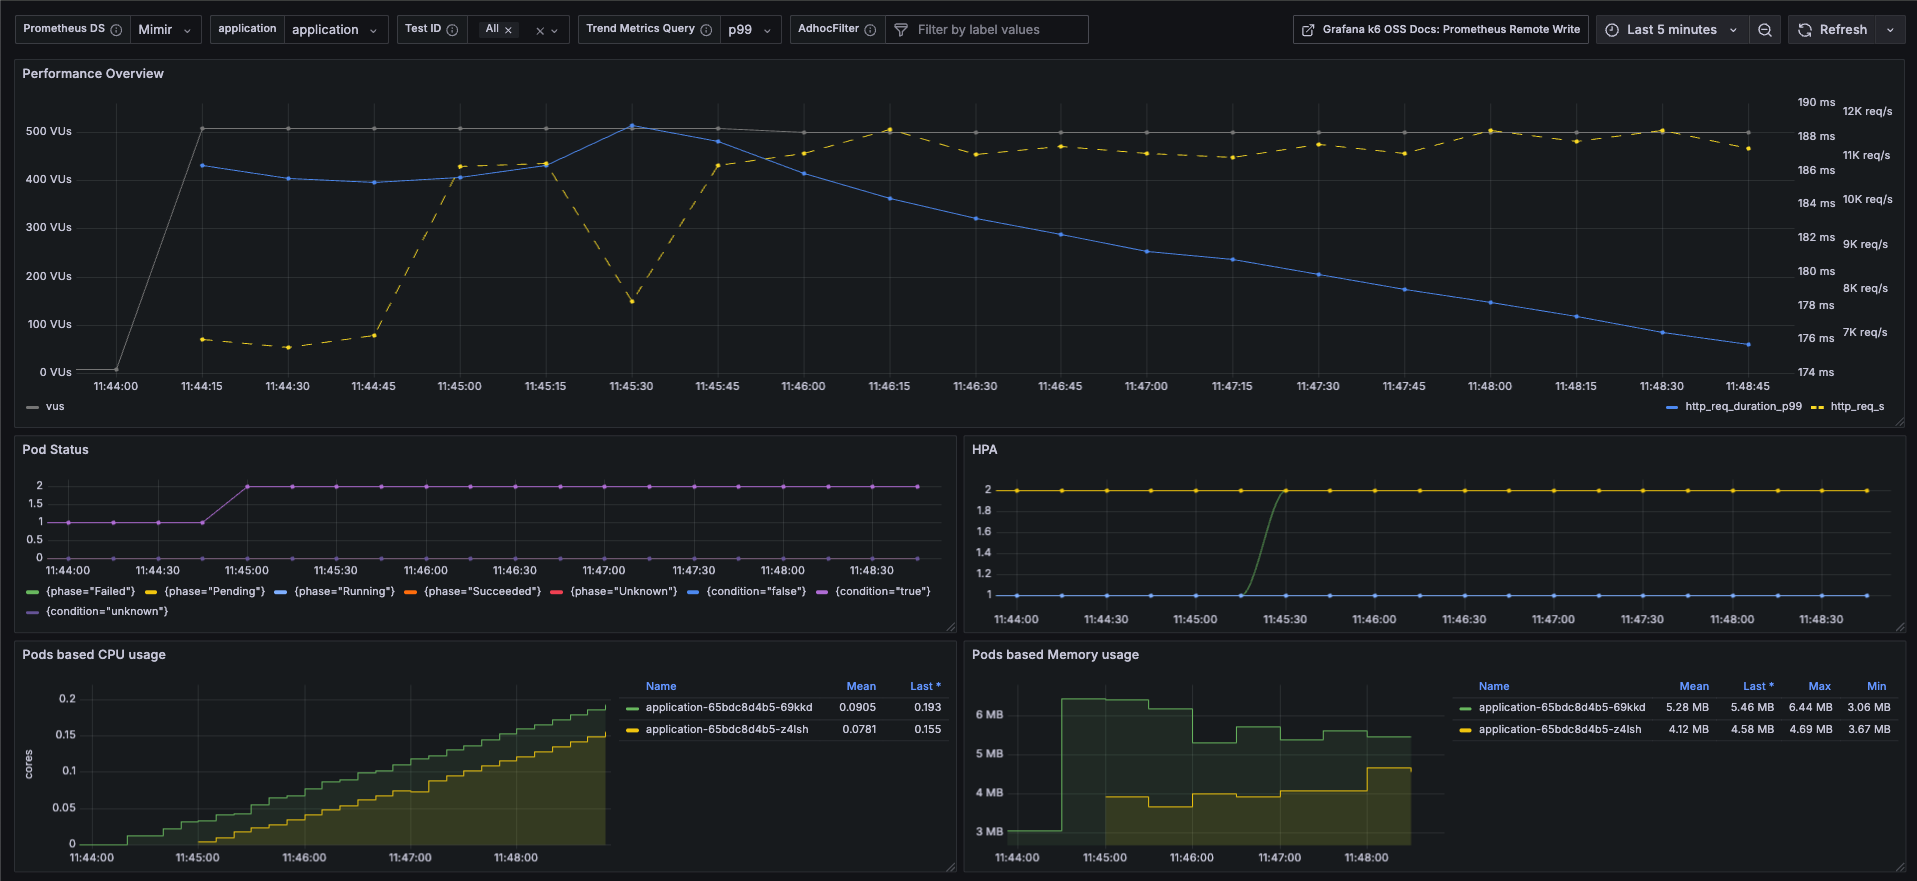
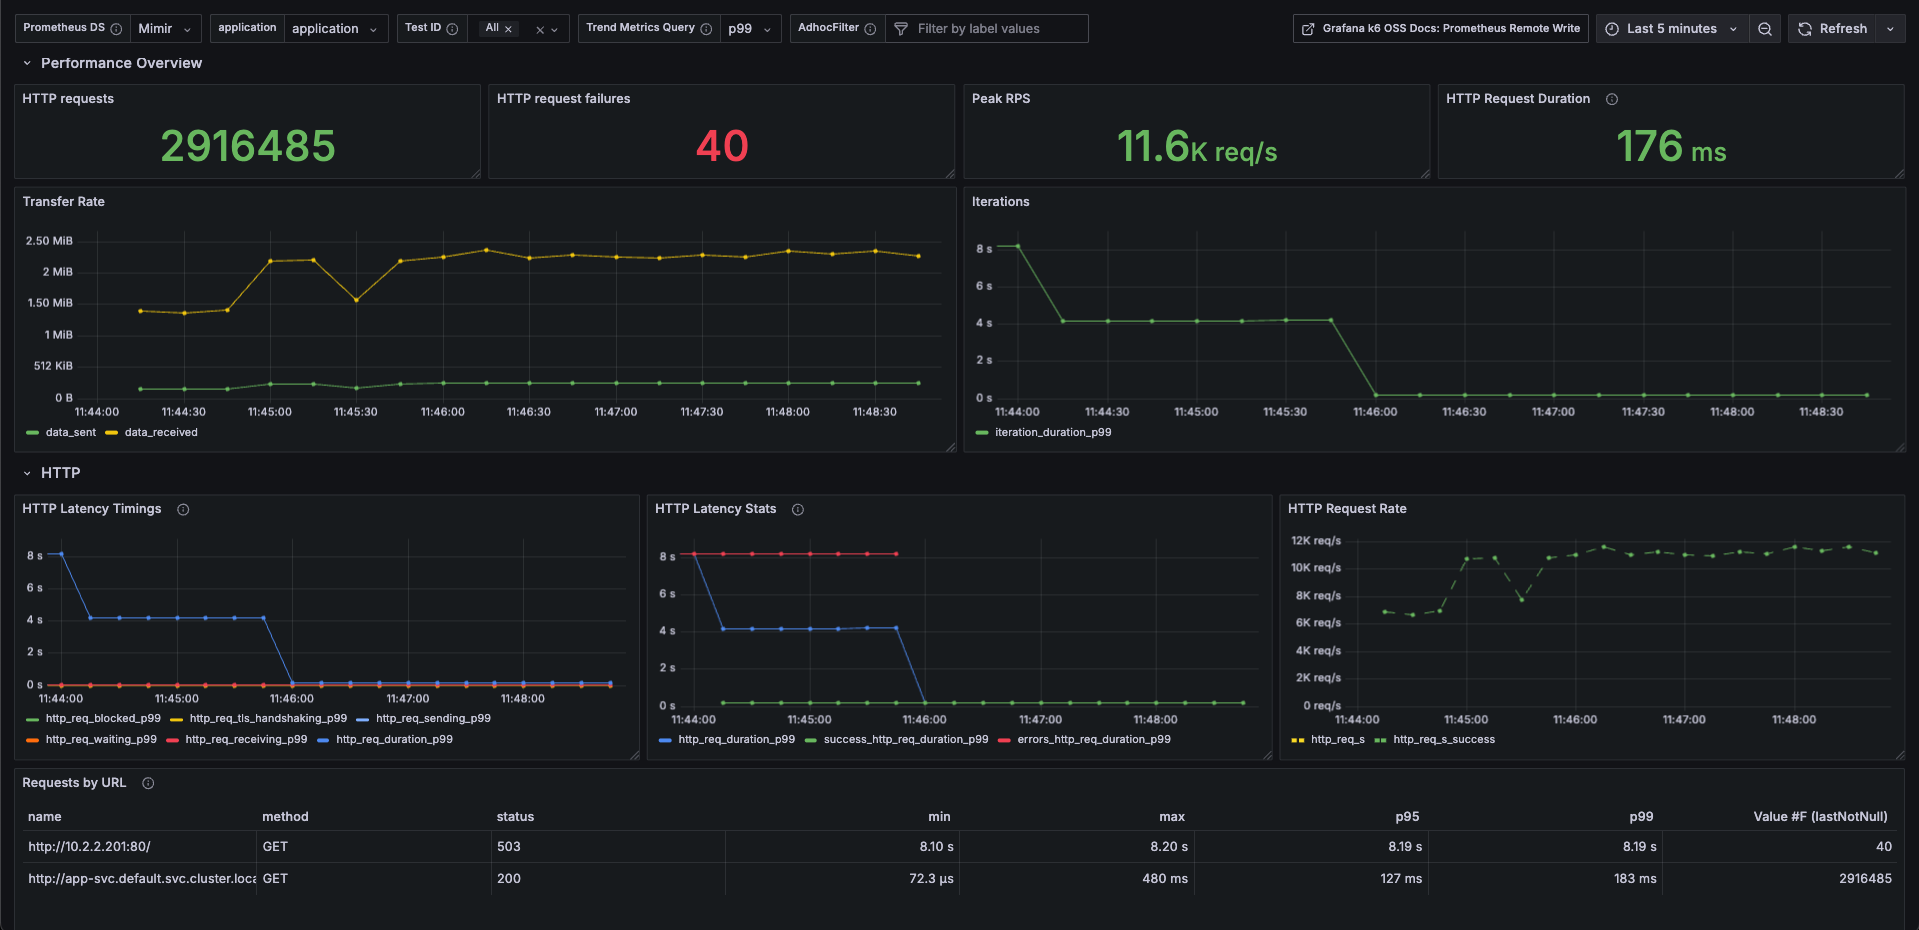
Improvement Description appName-based Test Result Mapping All k6 test results are segmented by appName (for example, payment-service, user-service, etc.), enabling side-by-side comparison of different components or microservices. Pod Status & HPA Observability Displays Pod lifecycle/status (Running, Pending, CrashLoopBackOff, etc.) and Horizontal Pod Autoscaler (HPA) status. This allows you to see how Kubernetes responds under load: whether pods fail, delay, or autoscale. Pod Resource Utilization Tracks CPU and memory usage per Pod during the test. Helps in identifying bottlenecks, over-provisioning, or resource constraints. Exclude Failed Requests from Duration Metrics Failed requests often skew latency/duration measurements. This dashboard version ensures duration/latency metrics are computed using successful requests only, preventing distortions from failures. Use Cases / Benefits
Verify that autoscaling behaves as expected under load (HPA metrics, Pod count changes).
Correlate test traffic (RPS / latency) with actual resource usage to find inefficiencies.
Identify service instability early by observing pod status changes during stress tests.
Ensure SLA or SLO compliance by reporting pure performance metrics (excluding failures).
Data source config
Collector config:
Upload an updated version of an exported dashboard.json file from Grafana
| Revision | Description | Created | |
|---|---|---|---|
| Download |