
Metabase
Dashboard for Metabase supported metrics
Metabase System Operations Dashboard for Grafana
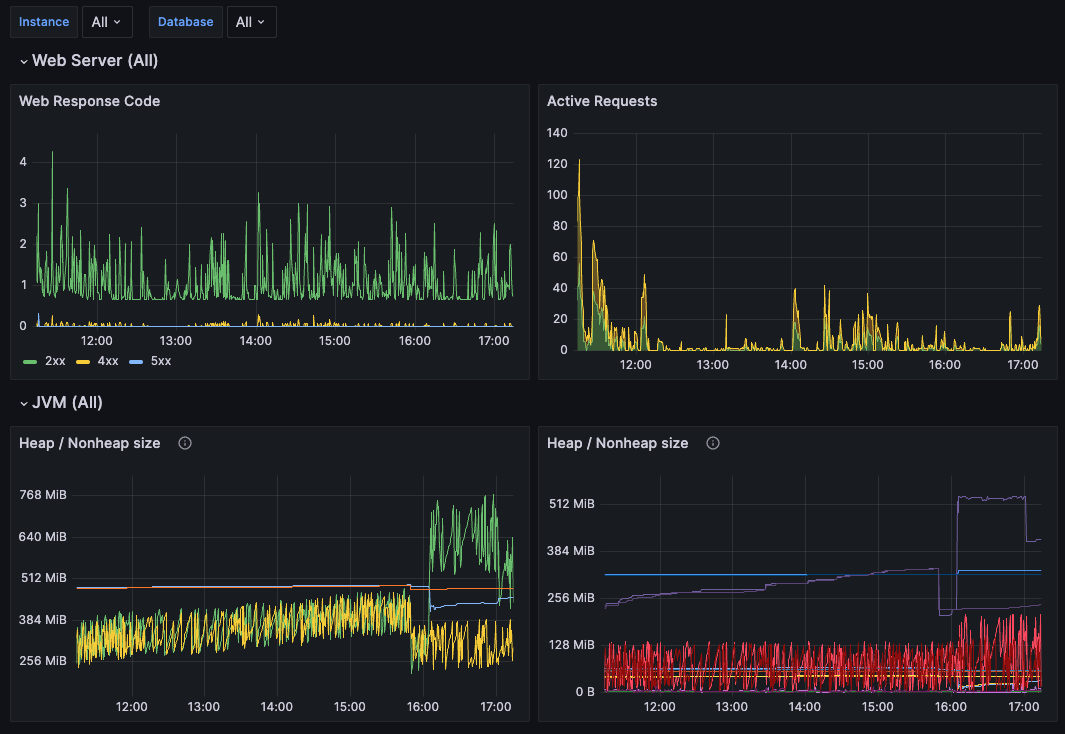
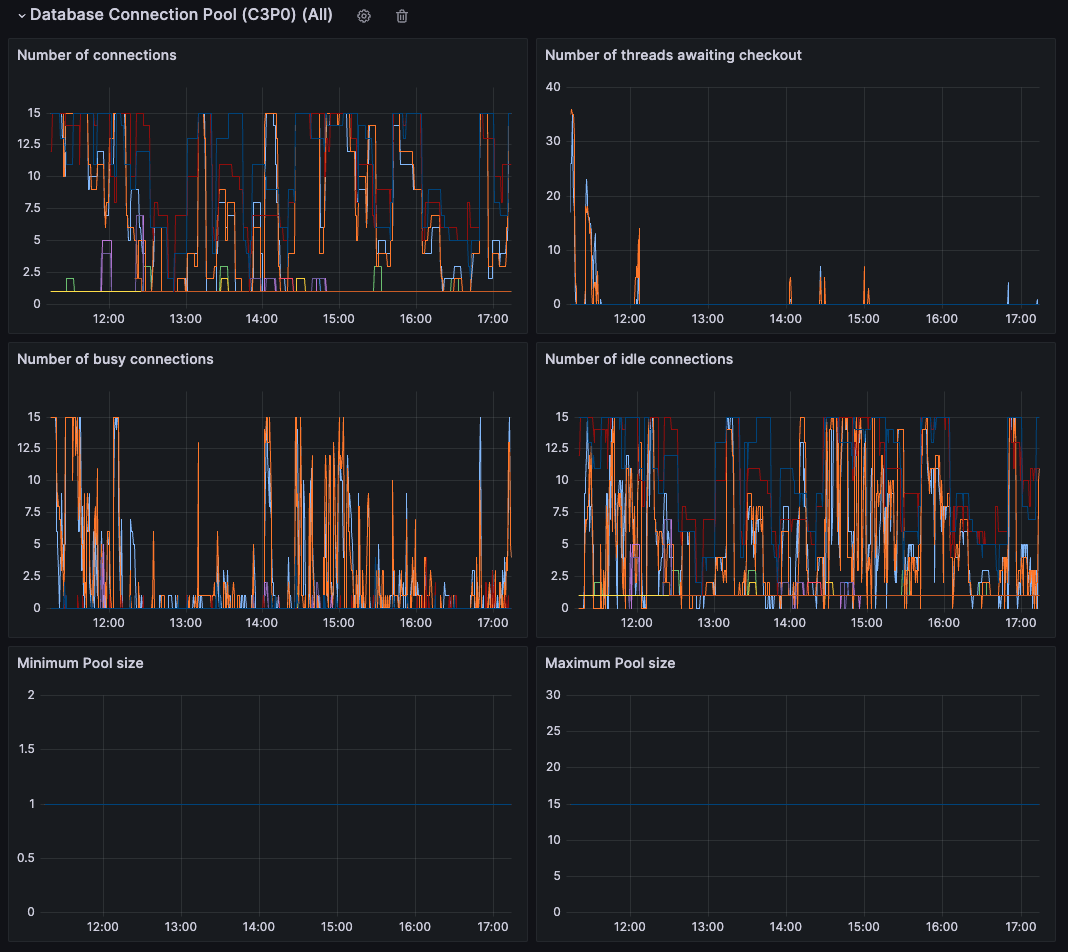
This dashboard is designed to help you monitor and understand the operational performance of your Metabase instance. It visualizes key metrics related to query performance, dashboard load times, and user activity, giving you deep insights into how your Metabase system is being used.
Maintenance & Support
This dashboard is maintained by yo-ga. The source code is available on the official GitHub repository.
If you encounter any issues, have suggestions, or find a bug, please open a new issue directly on the GitHub repository’s Issues page.
Data source config
Collector type:
Collector plugins:
Collector config:
Revisions
Upload an updated version of an exported dashboard.json file from Grafana
| Revision | Description | Created | |
|---|---|---|---|
| Download |