LiteLLM Trace
Detailed diagnostics view for a single LiteLLM request trace. Use the Trace Id variable to load a specific call and analyze its end-to-end behavior including spans, token usage, model details, completion output, and the full prompt conversation. Data is sourced from Azure Application Insights via the Azure Monitor datasource.

LiteLLM Trace Details
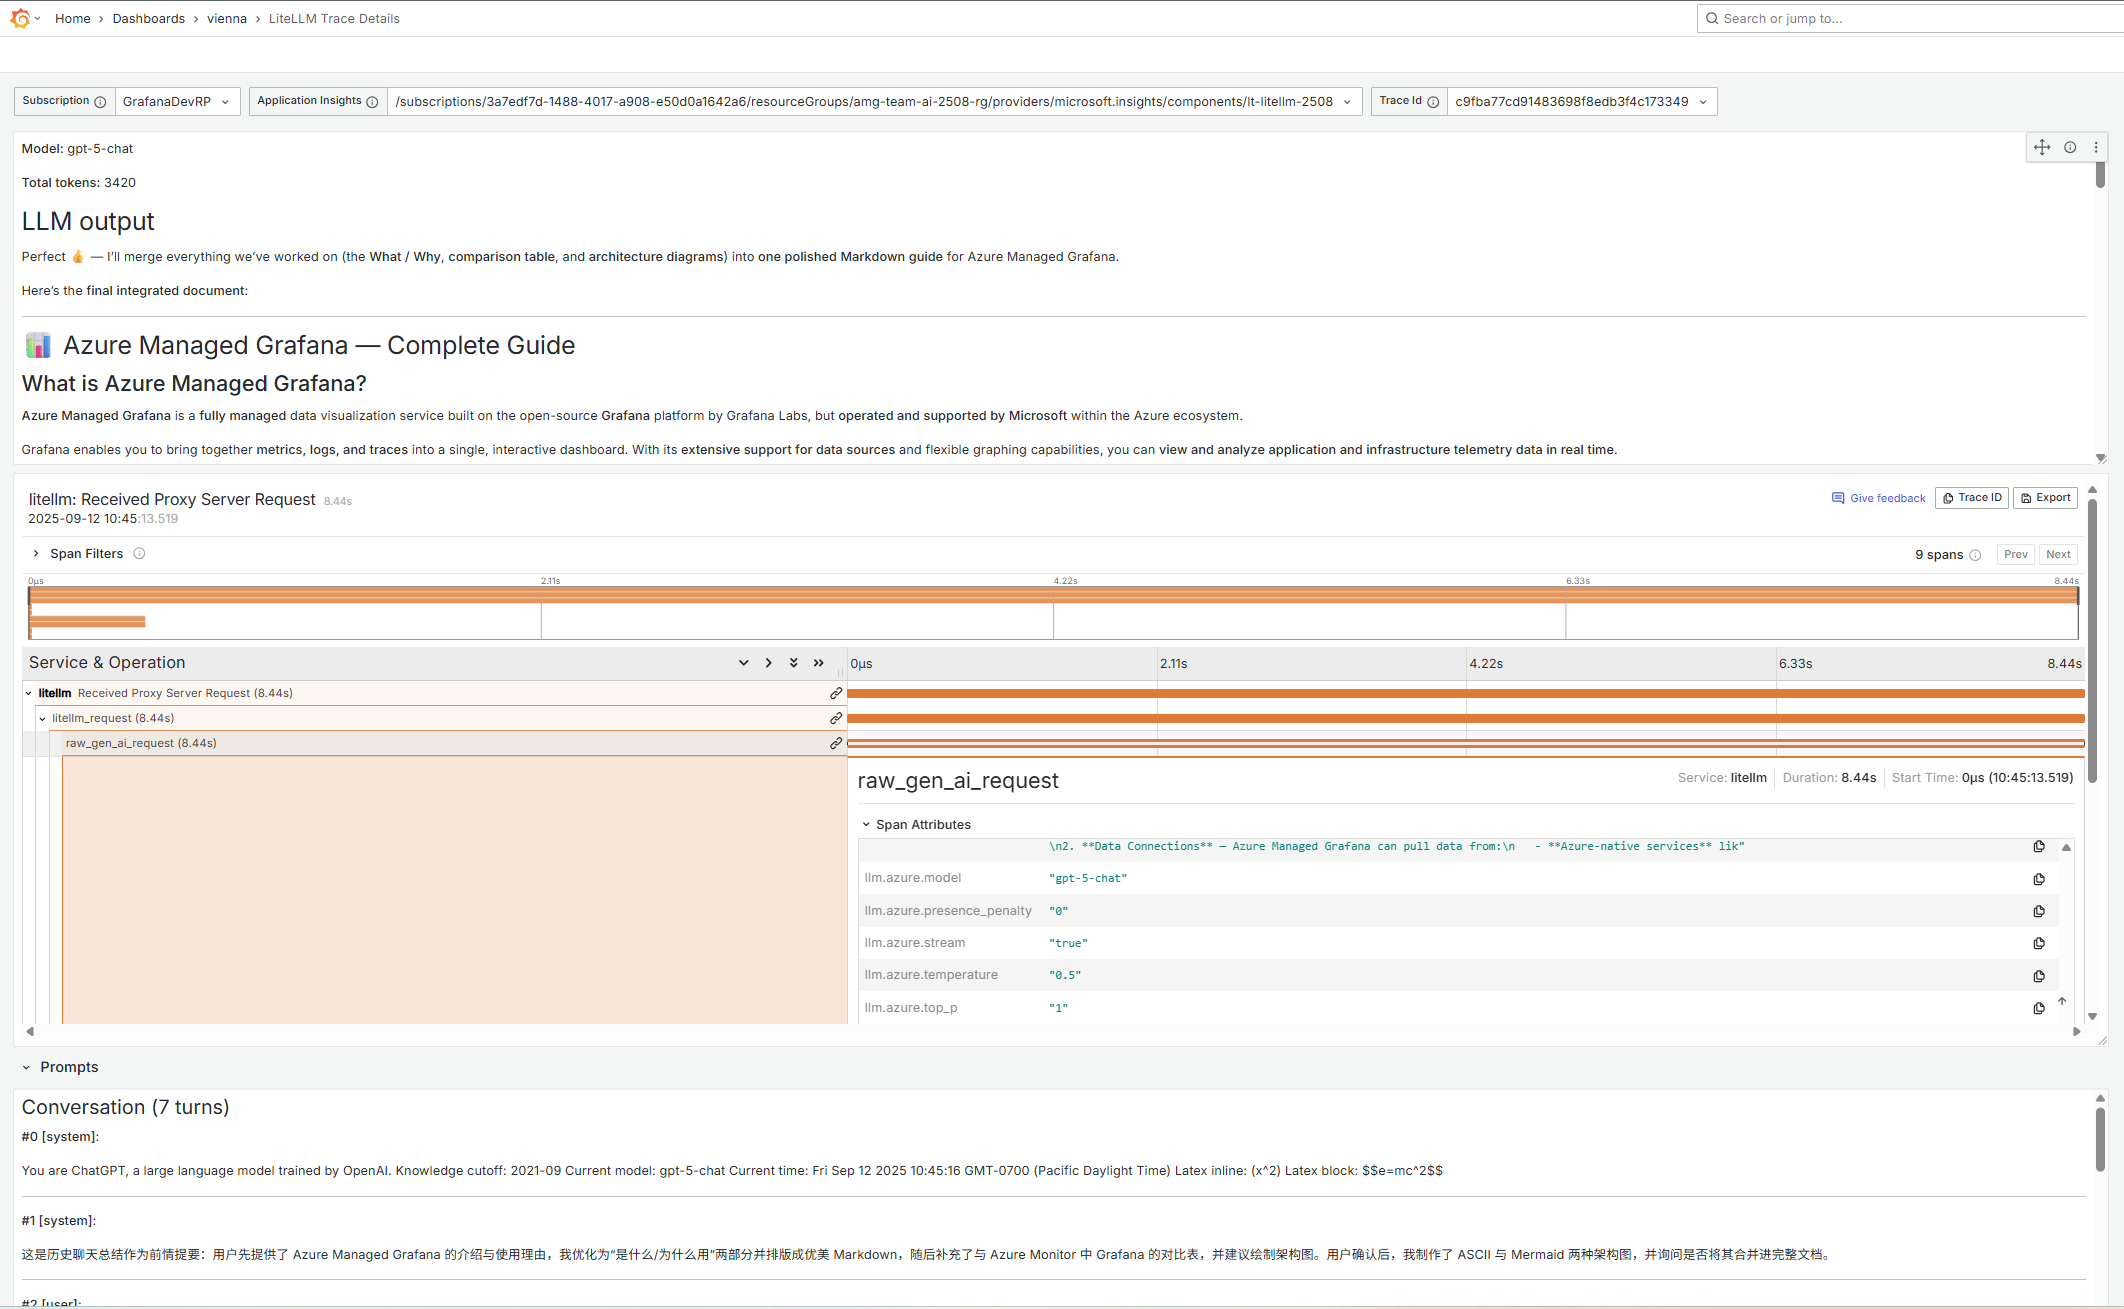
Detailed diagnostics for a single LiteLLM request trace using Azure Monitor (Application Insights) in Grafana. Inspect the end-to-end distributed trace, model and token usage, completion output, and the full prompt conversation captured by LiteLLM.
Screenshots


Issues and feedback
https://github.com/1w2w3y/grafana-dashboards/issues
Features
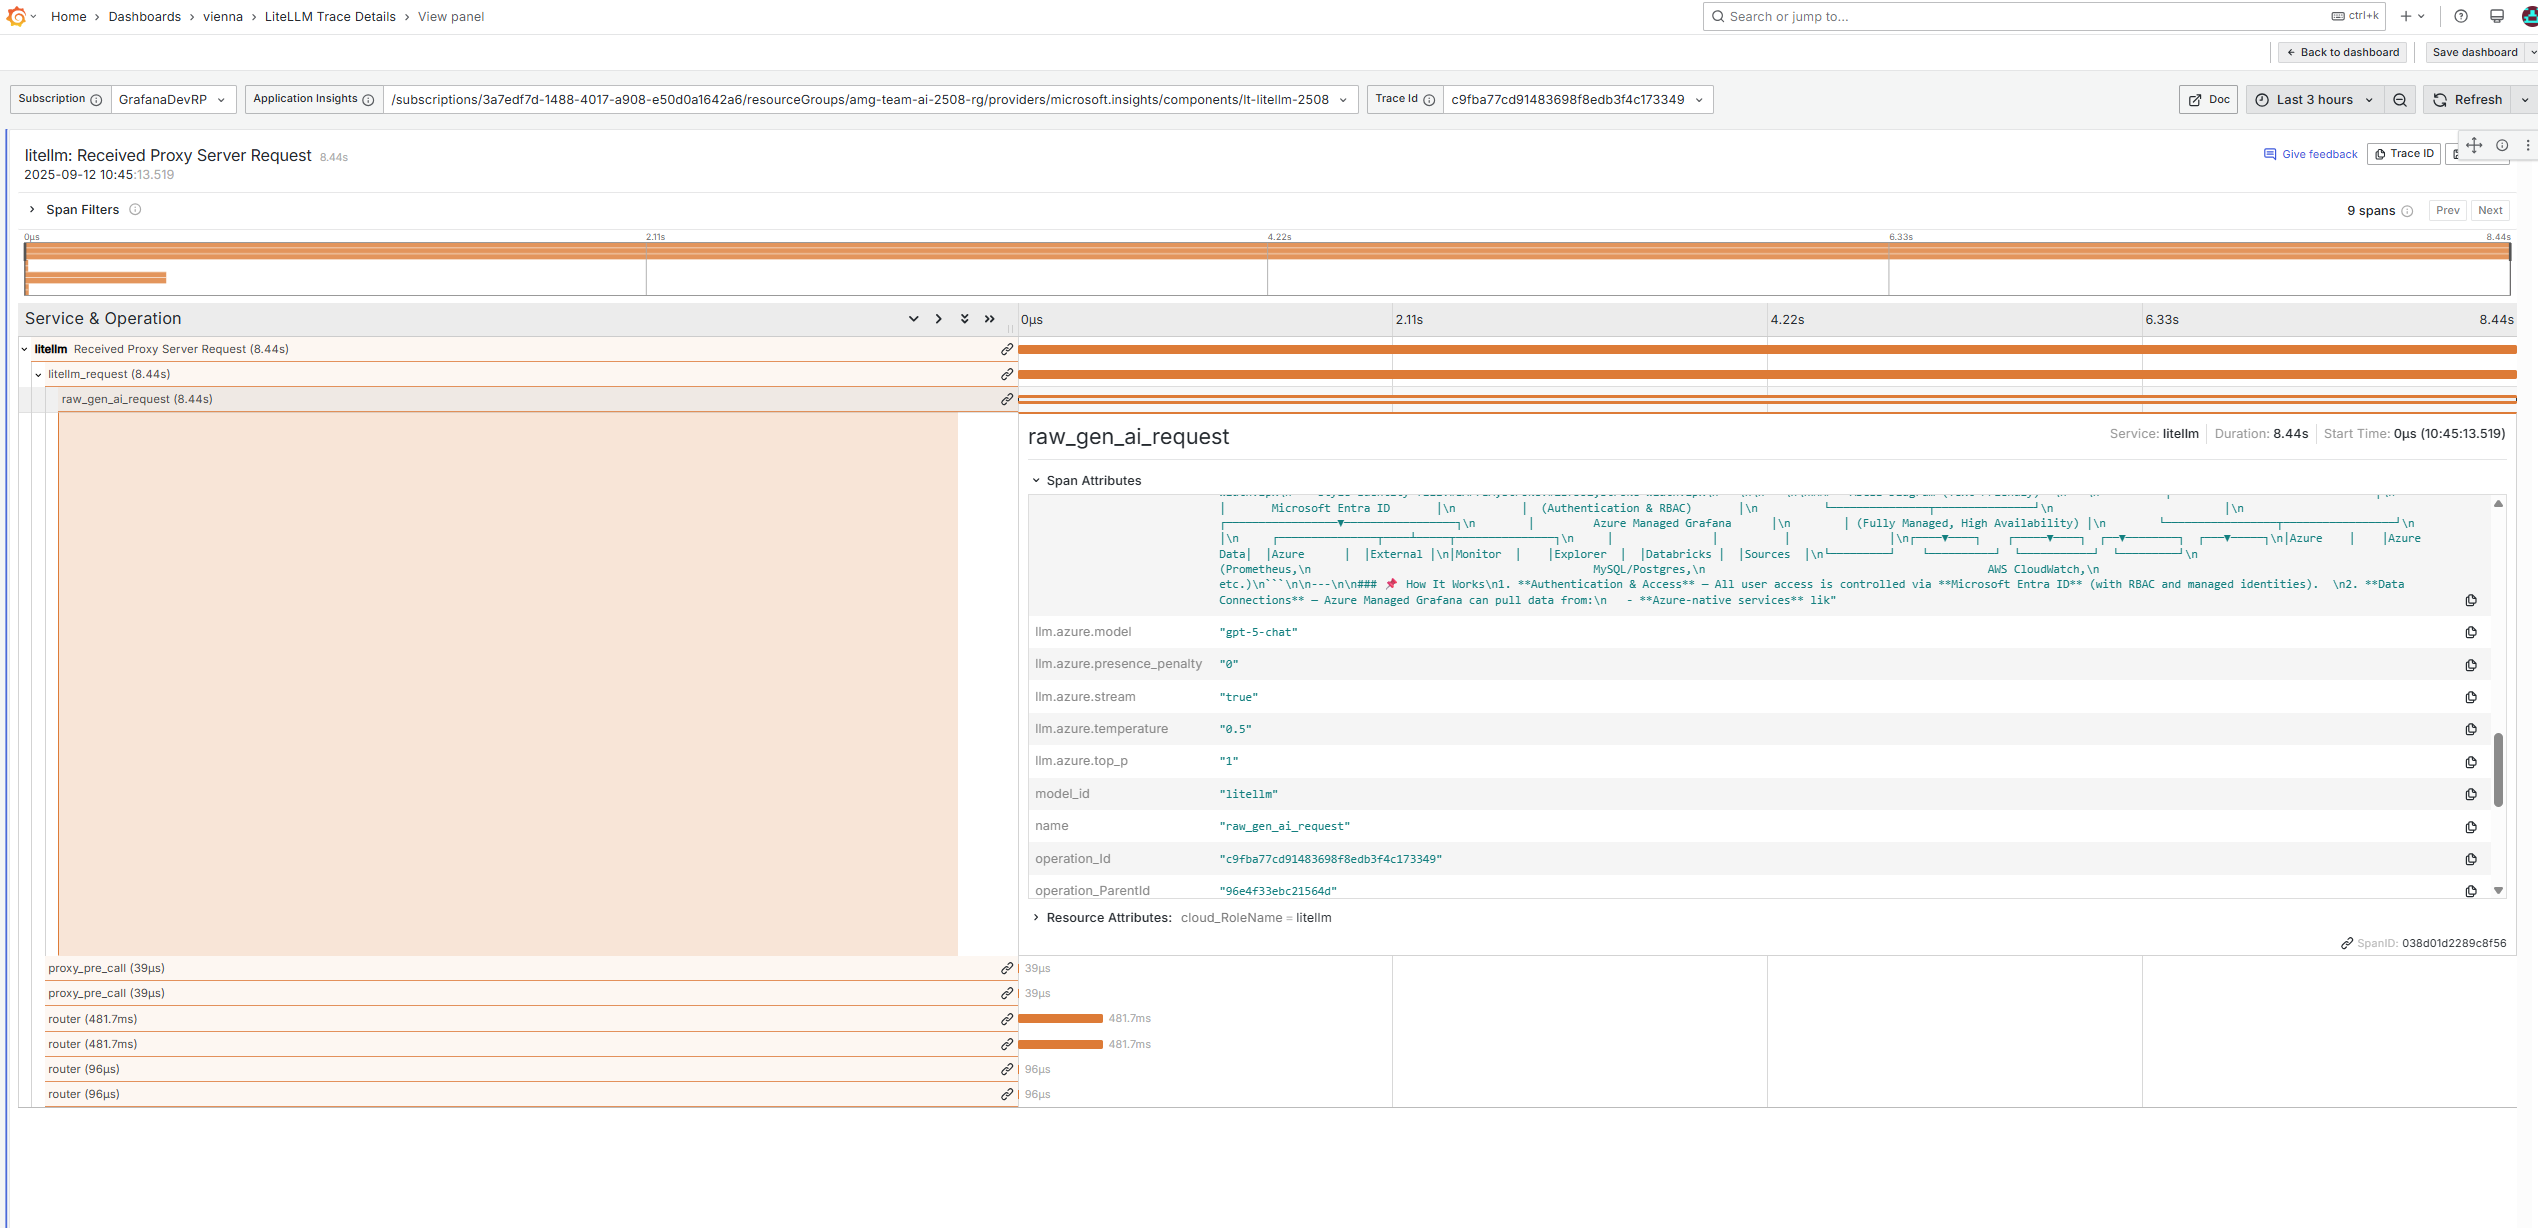
- End-to-end distributed trace
- Visualizes the span timeline for the selected request (
operation_Id), including requests, dependencies, exceptions, custom events, and traces. - Helpful for diagnosing latency issues and downstream call behavior.
- Visualizes the span timeline for the selected request (
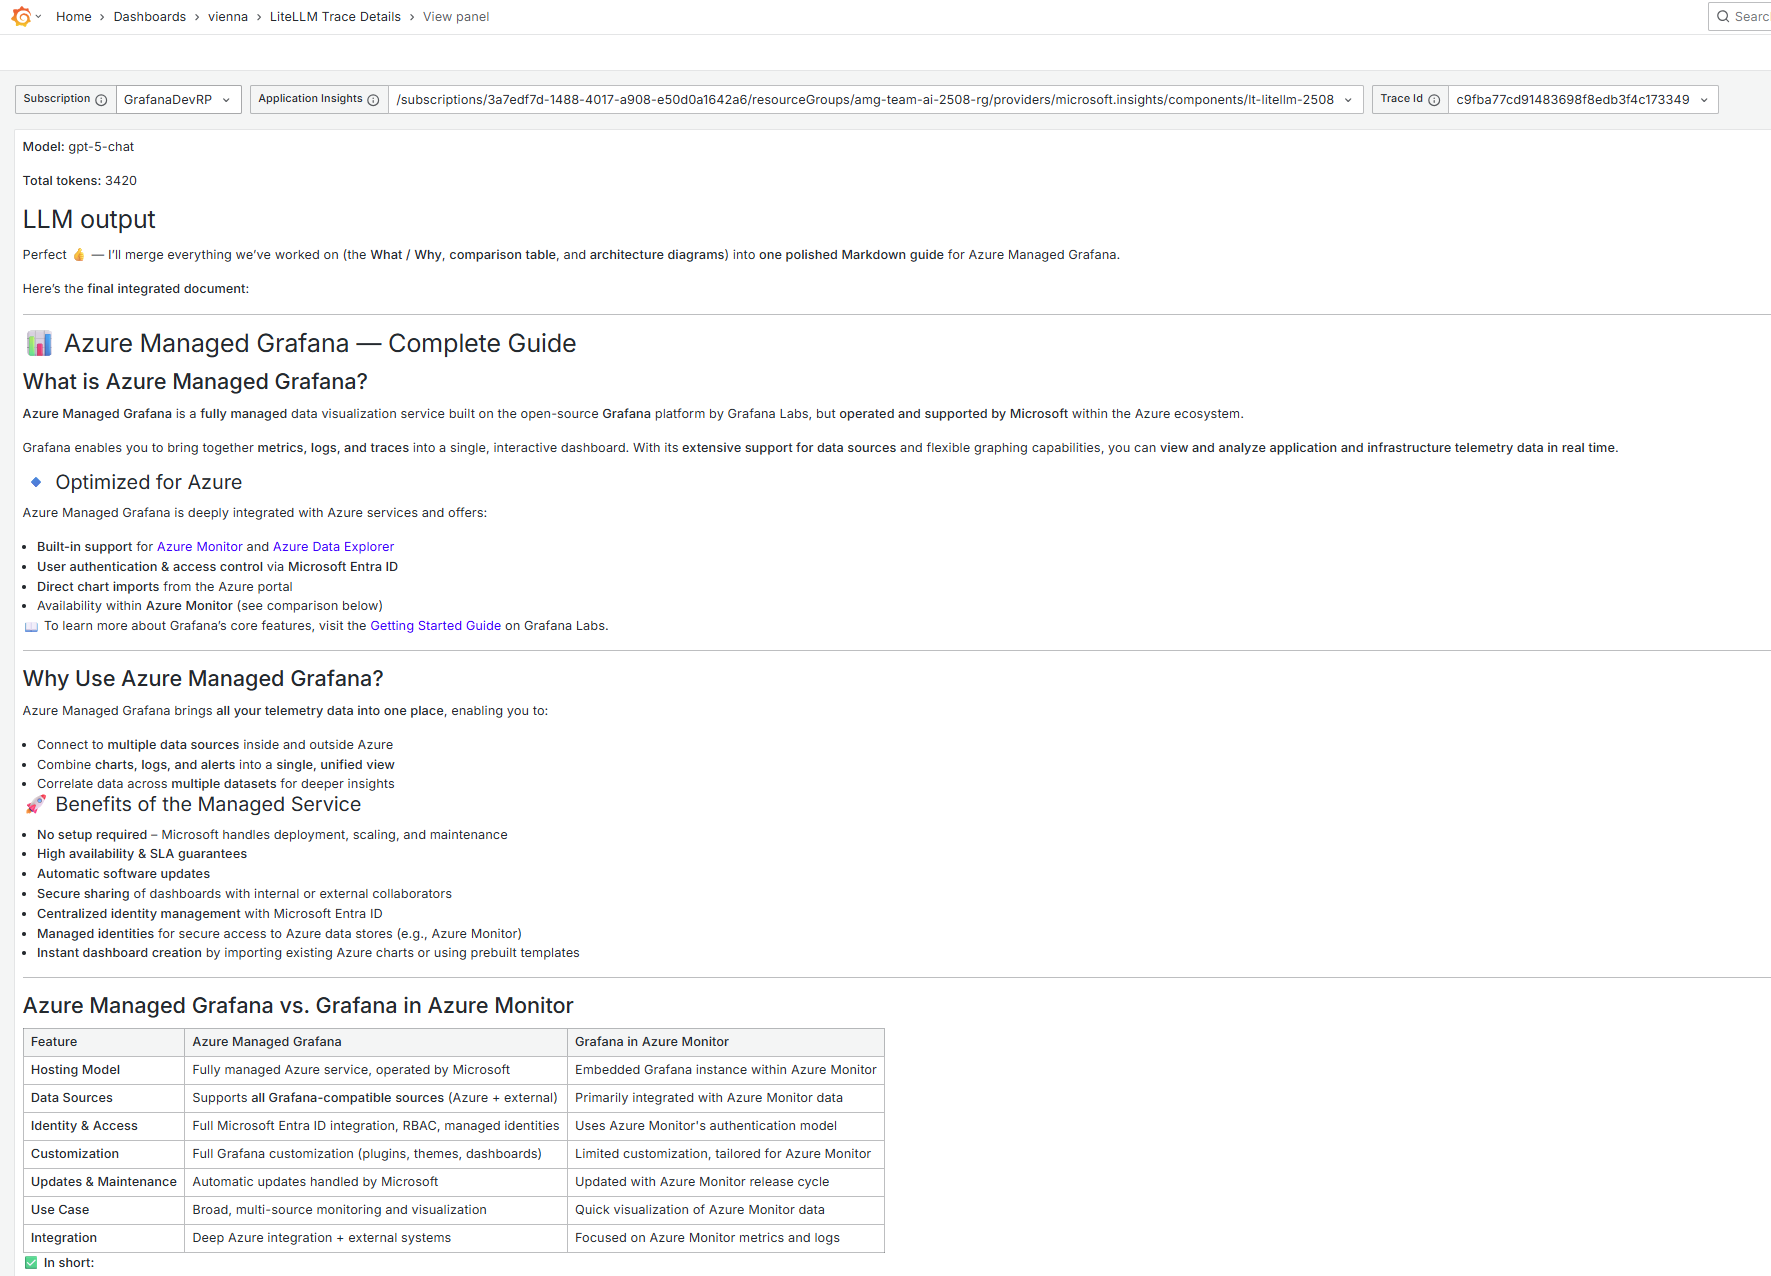
- LLM output and token summary
- Shows model (
gen_ai.request.model), total tokens (llm.usage.total_tokens), and the first completion content with its finish reason.
- Shows model (
- Full prompt conversation
- Reconstructs the entire conversation turns from
customDimensionskeysgen_ai.prompt.N.roleandgen_ai.prompt.N.content, ordered by turn index. - Displays an easy-to-read conversation with the total number of turns.
- Reconstructs the entire conversation turns from
- Flexible scoping
- Dashboard variables let you pick the Subscription, the target Application Insights resource, and the Trace Id (
operation_Id) to inspect.
- Dashboard variables let you pick the Subscription, the target Application Insights resource, and the Trace Id (
- Defaults optimized for investigations
- Default time range is the last 1 hour; suitable for ad-hoc deep dives on recent requests.
How it works?
- Data source: Grafana Azure Monitor data source.
- Azure Log Analytics queries against your Application Insights resource.
- Azure Traces query to render the distributed trace for the selected
operation_Id.
- Trace and details logic:
- The details panels read from the
dependenciestable and filter LiteLLM items:where name == "litellm_request".- Filter by the selected trace:
where operation_Id == "$litellmTraceId".
- Fields extracted from
customDimensions:- Model:
customDimensions["gen_ai.request.model"] - System prompt:
customDimensions["gen_ai.system"] - Tokens:
customDimensions["gen_ai.usage.prompt_tokens"],customDimensions["gen_ai.usage.completion_tokens"],customDimensions["llm.usage.total_tokens"] - Completion:
customDimensions["gen_ai.completion.0.role"],customDimensions["gen_ai.completion.0.content"],customDimensions["gen_ai.completion.0.finish_reason"]
- Model:
- Prompt reconstruction:
mv-expand bag_keys(customDimensions)and regex match^gen_ai\.prompt\.(\d+)\.(role|content)$to capture each turn.- Build per-index objects, order by
index, and generate readable markdown:- Header includes total turns, followed by each turn as role/content, separated by
---.
- Header includes total turns, followed by each turn as role/content, separated by
- The details panels read from the
- Variables:
subscriptionId— selected subscription.applicationInsightsResourceId— the Application Insights resource ID (discovered via Azure Resource Graph scoped by the selected subscription).litellmTraceId— the trace identifier (operation_Id) sourced fromdependencies | distinct operation_Idfor the selected resource and dashboard time.
Requirements
- Grafana 11.6+ with the Azure Monitor data source (11.6.x).
- Business Text panel plugin:
marcusolsson-dynamictext-panel(used to render model/tokens/output and the prompt conversation). - Read access to the target subscription and Application Insights component.
- LiteLLM must emit telemetry to Application Insights:
- OpenTelemetry dependency with
name == "litellm_request". - Custom dimensions as listed above for model, tokens, completion, and prompt turns.
- OpenTelemetry dependency with
Change history
- 9/12/2025 Initial version for Grafana 11.6
- 9/24/2025 Fix Application Insights resource selection variable
Data source config
Collector type:
Collector plugins:
Collector config:
Revisions
Upload an updated version of an exported dashboard.json file from Grafana
| Revision | Description | Created | |
|---|---|---|---|
| Download |