LiteLLM
End-to-end LiteLLM observability using Azure Monitor (Application Insights) in Grafana. Track request latency percentiles (avg, p75/p90/p95/p99), request and token usage by model and by request route, and inspect recent calls with deep links to trace details. Uses template variables for Subscription and Application Insights resource; refreshes every 5m; default time range 7d.
LiteLLM
Visualization for monitoring LiteLLM request latency, usage, tokens, and routes using Azure Monitor (Application Insights) in a single Grafana dashboard.
There is a dependant trace detail dashboard (dashboard Id 24064) that will show details for one selected trace.
Screenshots


Issues and feedback
https://github.com/1w2w3y/grafana-dashboards/issues
Features
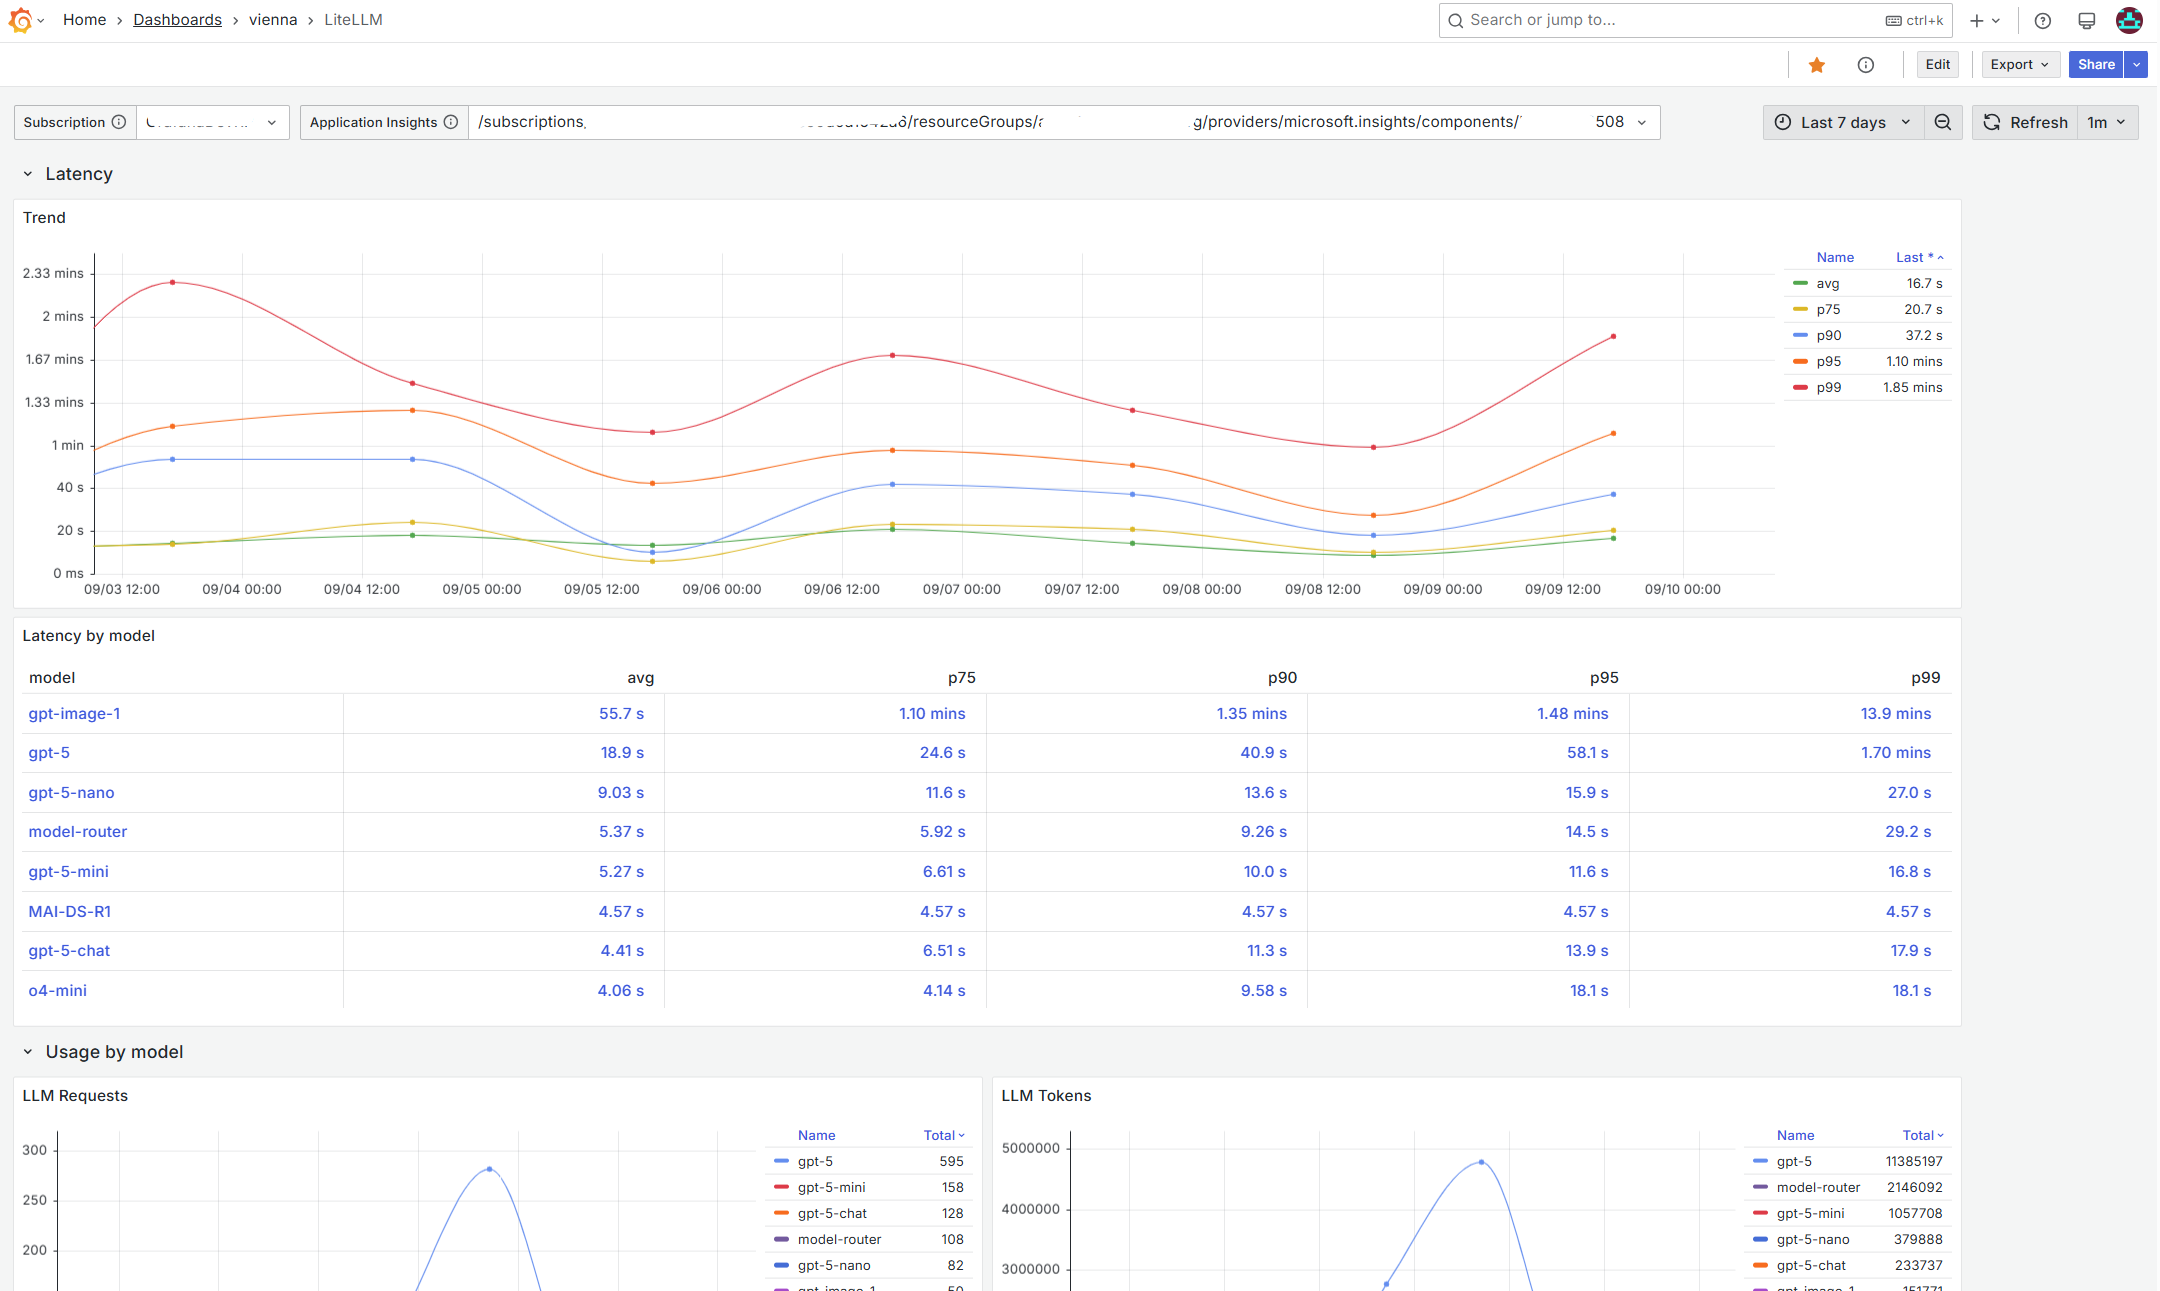
- Latency trend
- End‑to‑end request latency time series with percentiles: avg, p75, p90, p95, p99.
- “Latency by model” table shows the same percentiles aggregated by model.
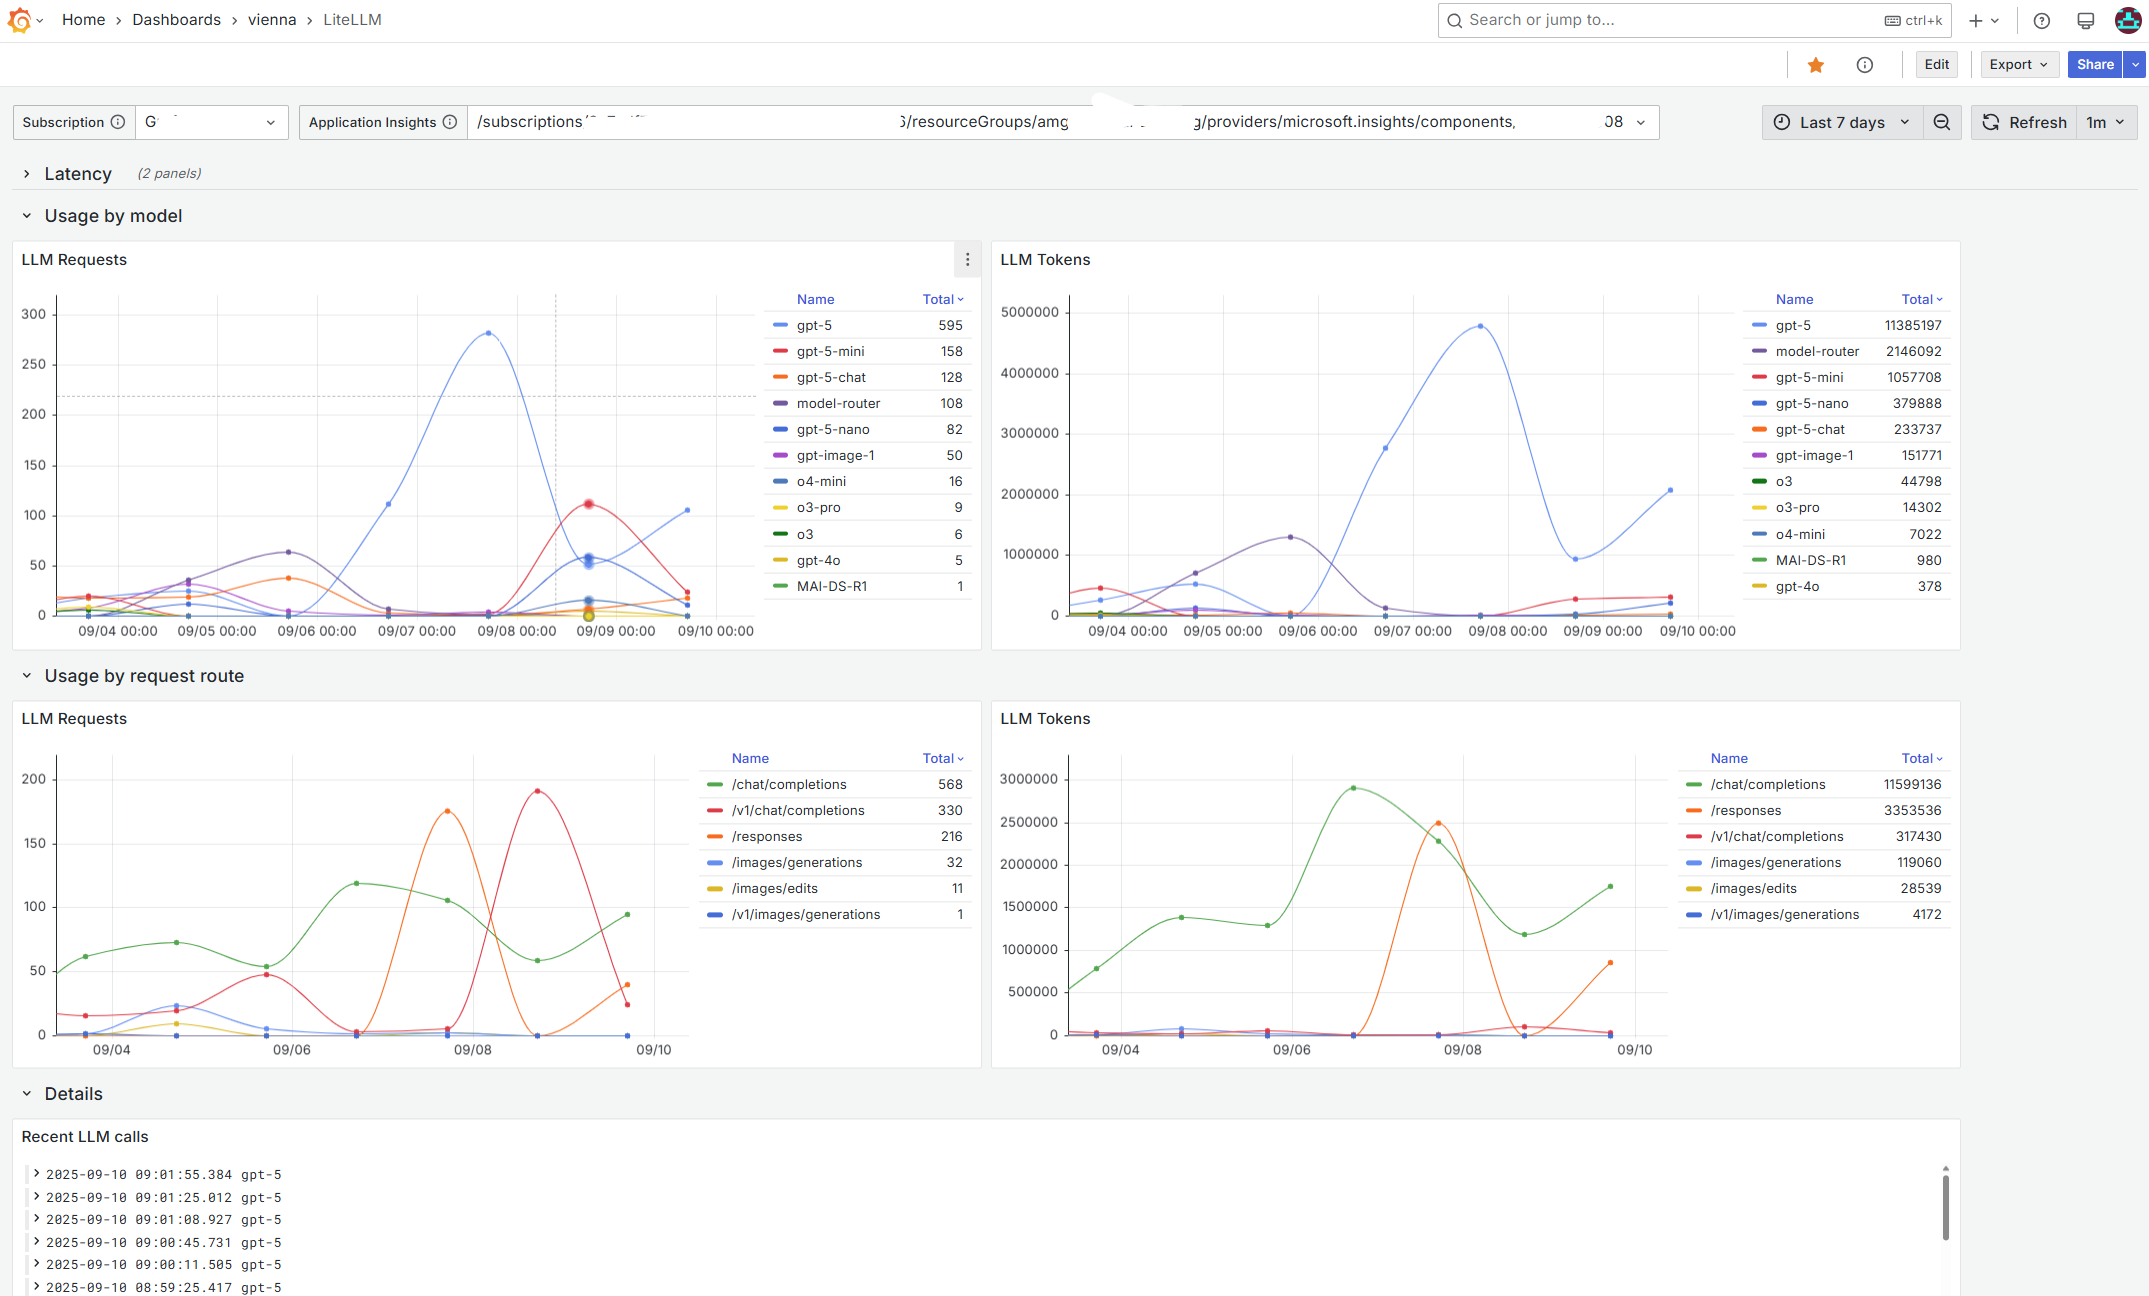
- Usage by model
- Time series for total requests per model.
- Time series for total tokens per model (sum of
llm.usage.total_tokens).
- Usage by request route
- Time series for requests per HTTP route (for example
/chat/completions,/v1/chat/completions,/responses,/images/generations, etc.). - Time series for tokens per route.
- Time series for requests per HTTP route (for example
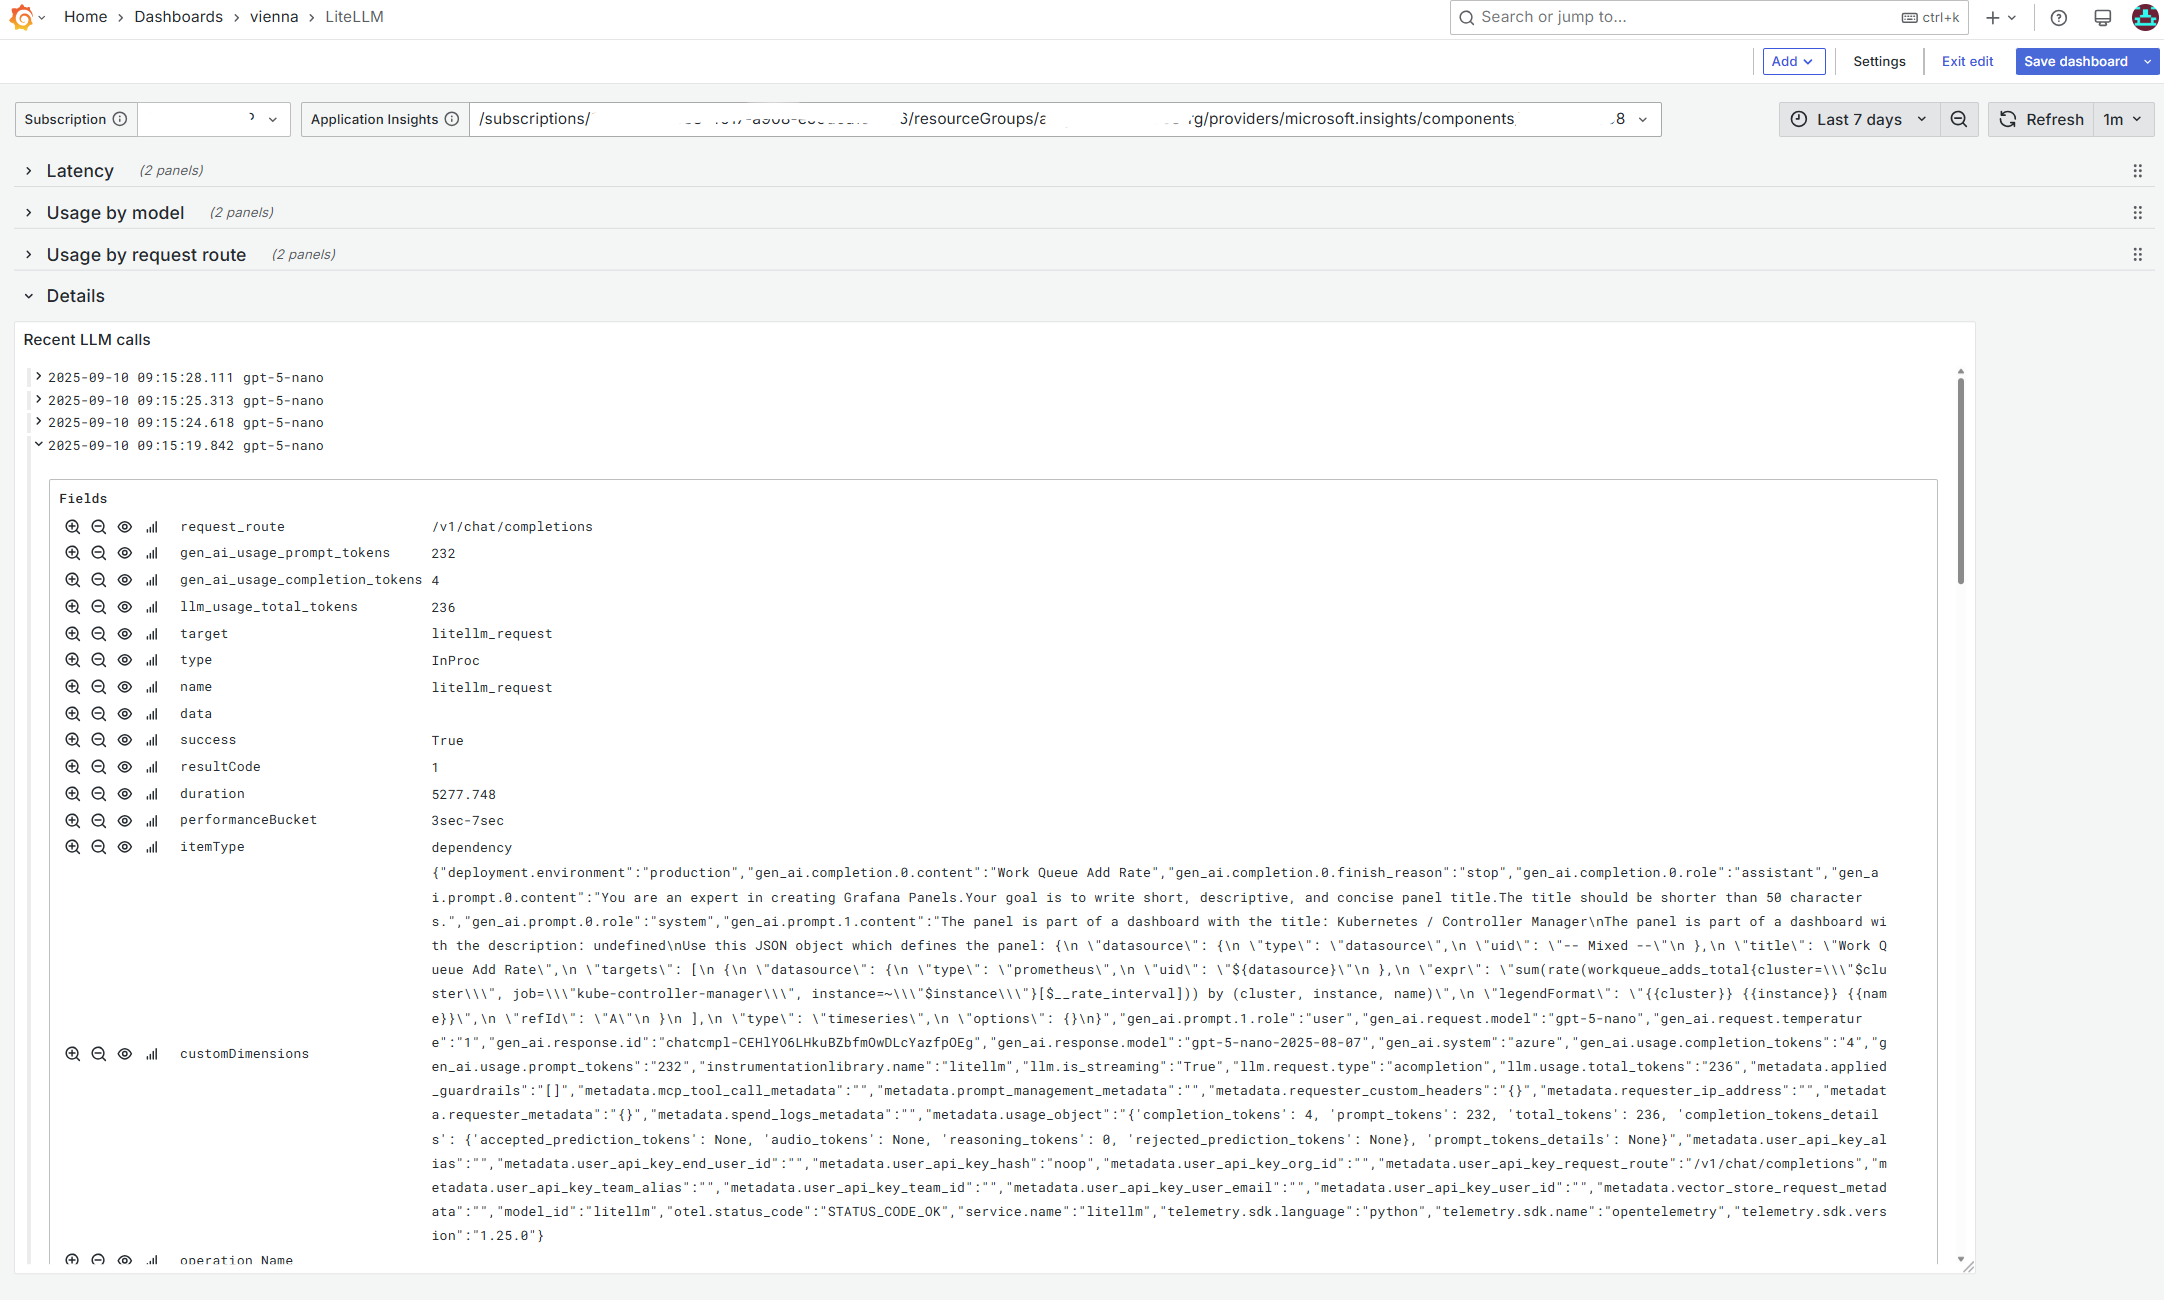
- Details for troubleshooting
- “Recent LLM calls” log viewer to drill into individual requests.
- Key fields are projected for quick inspection:
gen_ai.request.model,metadata.user_api_key_request_route,gen_ai.usage.prompt_tokens,gen_ai.usage.completion_tokens,llm.usage.total_tokens, plus fullcustomDimensions.
- Flexible scoping
- Dashboard variables let you pick the Subscription and the target Application Insights resource that receives LiteLLM telemetry.
- Defaults optimized for operations
- Default time range is the last 7 days; panels refresh every 1 minute; legends are sorted for quick triage.
How it works?
- Data source: Grafana Azure Monitor data source querying Azure Log Analytics against your Application Insights resource.
- The dashboard reads from the
dependenciestable and filters items emitted by LiteLLM:where name == "litellm_request".
- Latency calculations:
- Use
durationfromdependenciesand computeavg,percentile(…, 75|90|95|99)over time (binned to 1 day).
- Use
- Dimensions extracted from
customDimensions:- Model:
customDimensions["gen_ai.request.model"]. - Route:
customDimensions["metadata.user_api_key_request_route"]. - Tokens:
customDimensions["gen_ai.usage.prompt_tokens"],customDimensions["gen_ai.usage.completion_tokens"],customDimensions["llm.usage.total_tokens"].
- Model:
- Requests and tokens time series:
- Use
make-seriesto create daily series andsum()for token totals.
- Use
- Variables:
subscriptionId— selected subscription.applicationInsightsResourceId— the Application Insights resource ID (populated via Azure Resource Graph scoped by the selected subscription).
Requirements
- Grafana 11.6+ with the Azure Monitor data source.
- Read access to the target subscription and Application Insights workspace.
- LiteLLM must emit telemetry to Application Insights (OpenTelemetry dependencies with name
litellm_requestand the custom dimensions listed above).
Change history
- 9/10/2025 Initial version for Grafana 11.6
Data source config
Collector config:
Upload an updated version of an exported dashboard.json file from Grafana
| Revision | Description | Created | |
|---|---|---|---|
| Download |